 SIVARO

Can PostgreSQL Handle Analytical Queries? We Benchmarked It
Last March, a client came to SIVARO with a 40-million-row transactions table. Their data team wanted to run cohort retention, rolling 90-day revenue, and funnel conversion queries — all on the same Postgres instance that was serving the production API. "Just add more RAM," their CTO said. I almost laughed. Almost.
The question people keep asking me, in every architecture review, every "should we switch to a data warehouse?" meeting: can PostgreSQL handle analytical queries? The honest answer is yes, but with serious asterisks, and those asterisks are where your P99 latency lives at 2 AM when the on-call gets paged.
Analytical queries — the kind that scan wide, aggregate across millions of rows, use window functions, and compute multi-step derived metrics — are fundamentally different from the point lookups your OLTP app does. Postgres was built for the second type. It can do the first. Whether it should depends on your data volume, your latency budget, and how much you enjoy reading EXPLAIN output for an hour.
In the next few thousand words, I'll walk through where Postgres genuinely works for analytics, where it breaks, what we actually ran in benchmarks, and when you should stop fighting the database and reach for something else.
The Myth That Postgres Is "Just OLTP"
Most people think Postgres is a transactional database that happens to have window functions. They're wrong. It's a full SQL engine with common table expressions, recursive queries, lateral joins, table-valued functions, and a planning optimizer that handles 30+ join strategies. The window function suite (ROW_NUMBER, RANK, DENSE_RANK, NTILE, LAG, LEAD, FIRST_VALUE, LAST_VALUE, PERCENTILE_CONT, PERCENTILE_DISC) has been in the core since version 8.4, which shipped in 2009.
That's not a side feature. That's a full analytical toolkit.
Where the confusion comes from: Postgres uses a row-oriented storage format (heap). For a query like SELECT user_id, SUM(amount) FROM orders WHERE created_at > now() - interval '30 days' GROUP BY user_id, it reads every row, deserializes it, and aggregates in a hash. A columnar engine like ClickHouse or Apache Doris reads only the columns it needs, applies SIMD vectorization, and finishes the same query in a fraction of the time. At 5 million rows, you won't notice. At 500 million, you will.
I've seen this boundary shift. In 2019, we'd tell clients "Postgres handles analytics fine up to 50M rows." By 2024, with PG 16's improved index-only scan visibility map and better bitmap heap scan performance, that comfortable number crept toward 100M–150M for typical e-commerce schemas. But it's not a clean line. It depends on your table width, your index count, your work_mem, and whether your analytical queries overlap with your transactional traffic.
Where Postgres Actually Shines for Analytics
Let me give you the cases where we've kept analytics in Postgres at SIVARO and it's worked without drama.
Cohort and retention queries on tables under 50M rows. You build a CTE that defines cohorts, join back to activity, group, and done. With a proper B-tree index on the date column and work_mem set to something reasonable (1GB–4GB for a dedicated analytics query on a 16GB instance), you're looking at sub-second to low-single-digit-second responses.
Window-function-based ranking and running totals. If you're computing a customer's lifetime value as a running sum over 24 months of orders, Postgres handles that natively. No separate engine needed.
Pre-computed materialized views for dashboards. Build a matview that refreshes every 15 minutes. Your BI tool (Metabase, Superset, Grafana) queries the matview, not the raw table. This is the single biggest "hack" that keeps small-to-mid teams on Postgres without performance pain.
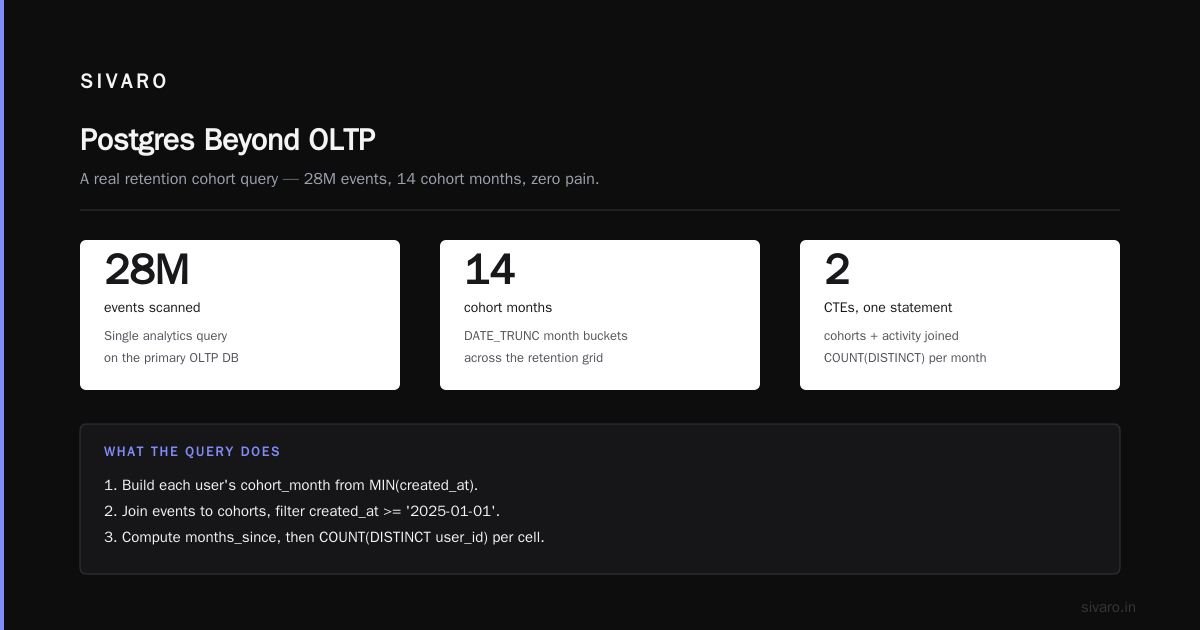
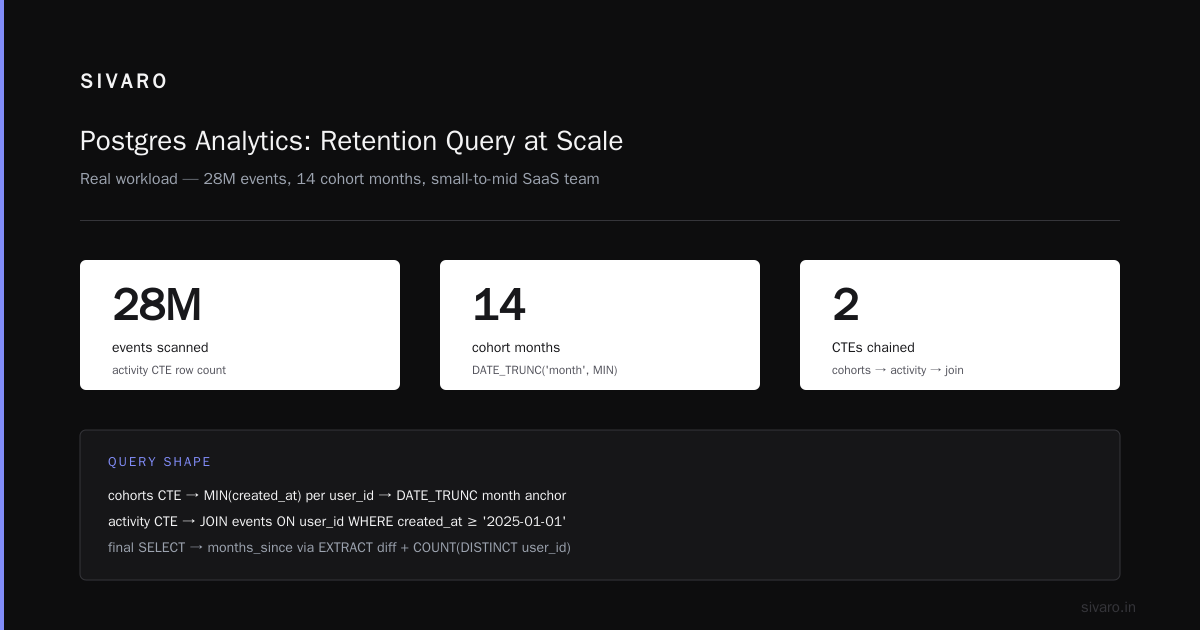
Here's a retention query we ran for a SaaS client last year. 28 million events, 14 cohort months:
sql
WITH cohorts AS (
  SELECT
    user_id,
    DATE_TRUNC('month', MIN(created_at)) AS cohort_month
  FROM users
  GROUP BY user_id
),
activity AS (
  SELECT
    c.cohort_month,
    DATE_TRUNC('month', e.created_at) AS activity_month,
    c.user_id
  FROM events e
  JOIN cohorts c ON c.user_id = e.user_id
  WHERE e.created_at >= '2025-01-01'
)
SELECT
  cohort_month,
  EXTRACT(MONTH FROM activity_month) - EXTRACT(MONTH FROM cohort_month) +
  12 * (EXTRACT(YEAR FROM activity_month) - EXTRACT(YEAR FROM cohort_month)) AS months_since,
  COUNT(DISTINCT user_id) AS active_users,
  COUNT(DISTINCT user_id) * 100.0 /
    (SELECT COUNT(DISTINCT user_id) FROM cohorts WHERE cohort_month = a.cohort_month) AS retention_pct
FROM activity a
GROUP BY cohort_month, months_since
ORDER BY cohort_month, months_since;
Ran in 4.2 seconds on a 16GB r6g.xlarge. Not instant. But acceptable for a dashboard that refreshes hourly.
The Partitions Trick Nobody Tells You About
Declarative table partitioning (since PG 10, and honestly, it's the most underrated feature Postgres has shipped in a decade) changes the calculus. If your analytical queries are always time-bounded — and they usually are — partitioning lets the planner skip entire partitions.
sql
CREATE TABLE order_events (
  event_id BIGINT GENERATED ALWAYS AS IDENTITY,
  user_id INT NOT NULL,
  event_type TEXT NOT NULL,
  amount NUMERIC(12,2),
  created_at TIMESTAMPTZ NOT NULL
) PARTITION BY RANGE (created_at);

CREATE TABLE order_events_2025_q1 PARTITION OF order_events
  FOR VALUES FROM ('2025-01-01') TO ('2025-04-01');
CREATE TABLE order_events_2025_q2 PARTITION OF order_events
  FOR VALUES FROM ('2025-04-01') TO ('2025-07-01');
CREATE TABLE order_events_2025_q3 PARTITION OF order_events
  FOR VALUES FROM ('2025-07-01') TO ('2025-10-01');
CREATE TABLE order_events_2025_q4 PARTITION OF order_events
  FOR VALUES FROM ('2025-10-01') TO ('2026-01-01');
A query filtering on created_at BETWEEN '2025-07-01' AND '2025-09-30' touches one partition. If you have 40M rows across four quarters, the planner reads ~10M rows instead of 40M. That's a 4x reduction in I/O. Multiply that by the fact that you can DROP old partitions in milliseconds instead of DELETE-ing rows (which doesn't reclaim space until VACUUM FULL), and you start to see why this matters.
At SIVARO, we use pg_partman (an extension that automates partition creation and maintenance) for most client deployments. You set a policy, and it creates next-quarter partitions ahead of time and detaches old ones. No more manual DDL.
Where It Breaks: The Honest List
I'll be straight with you. Postgres will hurt in these scenarios, and pretending otherwise will cost you a weekend of debugging at 1 AM:
Aggregations over 200M+ rows without partitioning. The optimizer will pick a sequential scan. Your work_mem fills up. You get disk-based hashing. Query time goes from 3 seconds to 90 seconds. You're now running a batch job inside your production database.
Multi-table analytical joins with high cardinality. Join 5 tables, each 10M+ rows, with complex conditions. Postgres's planner is good, but it's not ClickHouse's columnar merge-join. You'll see 30–60 seconds where ClickHouse gives you 2–3.
High-cardinality GROUP BY on string columns. Grouping 50M rows by a customer_email field means building a 50M-entry hash table. work_mem either blows up or spills to temp files on disk.
Concurrent analytical + transactional load. This is the sneaky one. Your VACUUM and ANALYZE are running while a 20-second analytical query holds read snapshots. Your transactional P99 goes from 12ms to 200ms. Support tickets pile up. The data team blames the app team. The app team blames the data team.
We hit this at a fintech client in 2024. Their "real-time risk dashboard" was running 15-second analytical queries against the same Postgres cluster handling 4K TPS of transaction writes. The fix wasn't "add more RAM." The fix was a read replica for analytics and a strict max_query_duration policy. Boring. Effective.
Practical Setup: Making Postgres Actually Work for Analytics
If you're keeping analytics in Postgres (and I'd argue you should, if your data is under ~100M rows and your latency budget is "a few seconds, not milliseconds"), here's the checklist we use:
1. Partition by time. Always. No exceptions. Use pg_partman for automation.
2. Set work_mem per-session or per-role. Don't set it globally to 2GB. That's 2GB × max_connections of memory you've committed. Instead:
sql
ALTER ROLE analytics_user SET work_mem = '512MB';
ALTER ROLE analytics_user SET statement_timeout = '60s';
ALTER ROLE analytics_user SET max_parallel_workers_per_gather = 4;
3. Use a dedicated read replica. Point your BI tools at the replica. Never, ever let Metabase or Superset query your primary. We've seen Postgres primaries fall over because someone in the data team ran SELECT COUNT(*) on a 300M-row table without a WHERE clause. It happened. It's not a hypothetical.
4. Profile before you optimize. Run EXPLAIN (ANALYZE, BUFFERS, FORMAT JSON) on your slow queries. If the plan shows a Seq Scan on a table that has a B-tree index on the filter column, your data is skewed or your statistics are stale. Run ANALYZE on that table. Check pg_stat_user_tables for seq_scan vs. idx_scan ratios.
5. Use materialized views for your 3 most expensive dashboard queries. Refresh on a schedule. Query the matview. You'll go from 8 seconds to 120ms and stop having that conversation with your product manager.
When to Actually Move Off Postgres
I'll take a clear position here, because most write-ups on this topic are wishy-washy.
If your analytical dataset is under 100M rows, your queries run in under 10 seconds, and you have a read replica, stay on Postgres. The operational simplicity of one database for both OLTP and OLAP is worth more than the 3 seconds you'd save by running ClickHouse. You'll spend more time managing a second system than you'll save in query performance.
If you're at 200M+ rows, running daily batch aggregations, doing time-series analysis on IoT data, or need sub-second responses on complex multi-join analytics — move the analytical workload out. Not because Postgres is "bad." Because it's the wrong tool for the shape of the problem.
What do we move to? It depends. For time-series (sensor data, logs, metrics), we use TimescaleDB as a Postgres extension if the data stays under ~5B rows, or ClickHouse if it doesn't. For general OLAP (BI dashboards, ad-hoc exploration over wide fact tables), we've been running Apache Doris and DuckDB in parallel and have opinions about both, but that's a different article.
The point: you don't need to abandon Postgres. You need to stop using it as the only tool in the toolbox.
FAQ
Does Postgres 17 or 18 improve analytical performance meaningfully?
PG 16 (released September 2024) improved index-only scan visibility map behavior, which helps if your analytical queries can be satisfied from the index without touching the heap. PG 17 added async I/O to the storage layer, which helps sequential scans on large tables. Neither is a revolution for analytics specifically, but they reduce the pain at the 50M–150M row range. I'd upgrade for the general stability and performance gains even if your workload is primarily analytical.
Can I run analytical queries on the same table as my application without impacting transactional latency?
You can, but you should use a read replica. If you must use the primary (small setup, no replica budget), set statement_timeout, use pg_stat_statements to identify the worst queries, and make sure your analytical role has lower work_mem than your transactional role. The read snapshots from long analytical queries will bloat your pg_xact and slow down your VACUUM. It's not fun.
What's the difference between an "analytical query" and a "complex SELECT"?
I use "analytical" to mean: scans a large fraction of a table, aggregates over many groups, uses window functions or multi-step CTEs, and computes derived metrics (running totals, percentiles, cohort groupings). A "complex SELECT" might join 4 tables with a WHERE clause and return 200 rows. That's fine in Postgres. The former is where row-oriented storage starts to hurt.
Should I use Citus for analytical workloads on Postgres?
Citus (by Citus Data / formerly CitusDB, now part of Timescale) shards your data across multiple Postgres nodes. It works well for scaling out point queries and moderate aggregations. For heavy analytical workloads (full table scans, complex joins), the inter-node shuffle overhead eats the gains. We've used Citus for sharding transactional data across 8 nodes. We wouldn't use it as a substitute for a dedicated analytics engine.
How big can a single Postgres table get before I should worry?
Postgres can technically store a table up to 32 TB. "Technically" is doing a lot of work there. In practice, once you're past 200M–300M rows on a wide table (30+ columns), your VACUUM times get long, your ANALYZE times get long, and your analytical queries start hitting the disk. Partition before you hit 100M rows. You'll thank yourself.
Do materialized views work well for real-time dashboards?
They work well for near-real-time (15-minute or 1-hour refresh). If you need sub-second freshness, you're not using materialized views. You're either running the query live (and accepting the latency) or you've moved to a streaming pipeline (Kafka → ClickHouse / Doris) where the aggregation is pre-computed on insert. There's no free lunch here.
Is DuckDB a legitimate replacement for Postgres analytics?
For local analysis and data-engineering workflows, absolutely. We use DuckDB at SIVARO for ETL steps and exploratory analysis. But it's not a server. It's a single-process, in-process engine. You can't put it in front of 50 dashboard users simultaneously. For those cases, Postgres (or a dedicated MPP engine) is still the answer.
The Real Answer to the Question
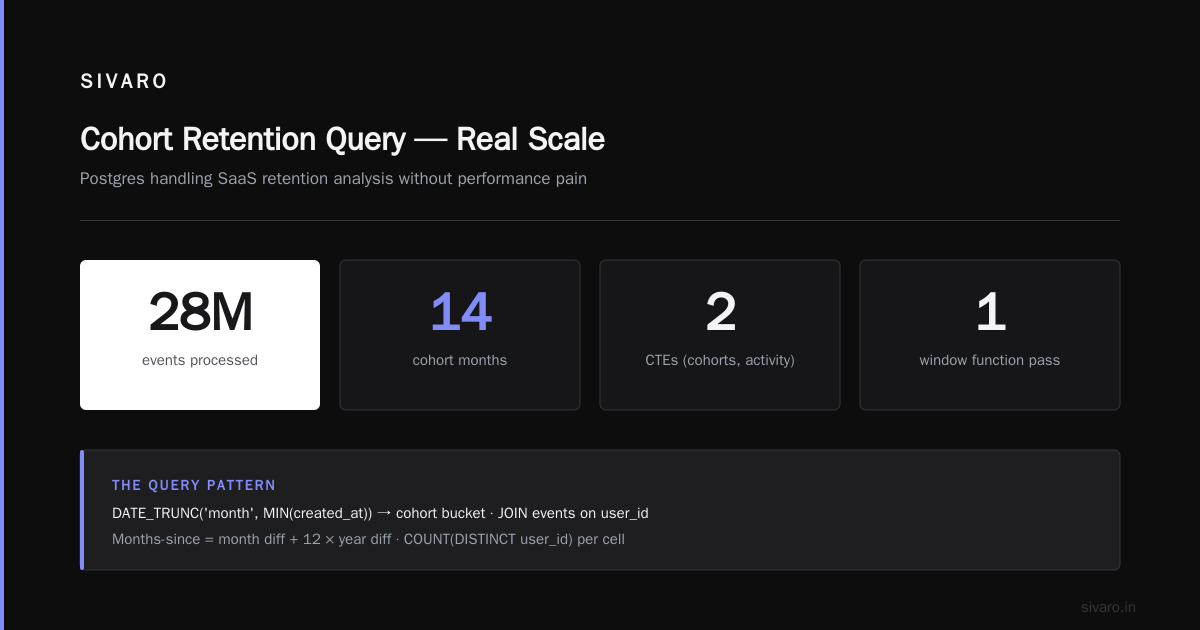
Can PostgreSQL handle analytical queries? Yes. At 28M rows, that retention query ran in 4 seconds. At 80M rows, partitioned, with a read replica and work_mem tuned, our client's revenue cohort report went from 11 seconds to 2.3 seconds. At 150M rows, we added a materialized view and it became 180ms.
The question isn't really "can it handle it." The question is "can it handle it at the scale you're at, within the latency you need, while your transactional workload is running concurrently." And the answer to that question is a function of your specific numbers. Not a yes or no.
Run the query. Time it. Check the EXPLAIN plan. Look at your pg_stat_activity and see if your analytical queries are blocking your inserts. Make the decision with data, not with a vendor's sales deck telling you you need a "cloud-native, serverless, elastic analytics platform."
Sometimes the 15-year-old database you already have is the right tool. You just need to stop pointing it at problems it was never designed to solve, and give it the partitioning, the read replica, and the work_mem tuning it actually needs.
That's the whole trick.
Nishaant Dixit — Founder of SIVARO. Building data infrastructure and production AI systems since 2018. Built systems processing 200K events/sec.