 SIVARO

Circuit Breaker Pattern Large Language Models
Three weeks ago I watched a 40-GPU inference cluster in Frankfurt fall over because one retry loop in a customer support bot kept hammering a degraded endpoint. Not a traffic spike. Not a bad deploy. Just a stubborn client that wouldn't give up. The circuit breaker pattern large language models depends on would've cut that outage to about 90 seconds. We didn't have it. We spent four hours rebuilding from ash.
That's the whole argument for this article. LLM systems don't usually die from raw load. They die from clients that keep asking nicely while the thing on the other end is already drowning.
A circuit breaker is a state machine that stops you from calling something that's already failing. Closed means normal. Open means stop. Half-open means test one request and see. That's it. Boring pattern, fifteen years old, borrowed from Michael Nygard's Release It! Pragmatic Bookshelf. And it's the single highest-leverage thing you can put in front of an LLM serving stack in 2026, because LLM failures are slow, expensive, and contagious in ways a typical REST call never is.
Here's what I'll cover: why LLMs break the breaker assumption, how to actually wire one up, where admission control and circuit breaking overlap and where they don't, and the trap everyone falls into when they pair a breaker with Kubernetes autoscaling.
Why LLM Failures Break the Normal Breaker Assumption
A normal circuit breaker assumes failure is fast and binary. Call times out or returns 500. You count errors, you trip.
LLMs don't fail like that.
A degraded vLLM instance under memory pressure will still return 200. It'll just do it in 45 seconds instead of 2. A model that's thrashing on KV cache eviction will answer, but the answer is subtly wrong. A quantized endpoint will silently drop quality without any error at all. And a rate-limited upstream (Anthropic, OpenAI, whoever you're routing to) returns 429s that look like client errors but are actually capacity signals.
This is the core mismatch. Failure in LLM land is latency-shaped, quality-shaped, and partial. Your breaker needs to understand all three.
I learned this the hard way in early 2025 running a RAG pipeline for a legal client. Our error rate stayed at 0.2% while p99 latency went from 3.4s to 38s. The breaker never tripped because there were no errors. Users churned. The dashboard was green. Green dashboards that lie are worse than red ones.
The fix was obvious in hindsight: trip on latency, not just errors. Add a rollback state for quality. And never, ever treat a 429 from an upstream model provider the same as a 400.
The Three States, Retranslated For Inference
Standard breaker has three states. LLMs need a fourth, and I'll get there.
Closed. Every request flows through. You're counting failures against a rolling window. For LLM serving I use a 10-second window, not the 60 seconds you'd use for a database. Latency degrades fast in GPU-land; a minute-old signal is archaeology.
Open. Breaker tripped. All requests fail immediately with a fallback — a smaller model, a cached response, or a queue-and-retry-later response. This is where you save your cluster. The Frankfurt incident would've been contained here.
Half-open. After a cooldown (I use 5s for LLMs, 30s for traditional services), let exactly one request through. If it succeeds, close. If it fails, back to open.
Degraded (the fourth state). This is my addition and I'll fight anyone who says it's unnecessary. In degraded state, you route a percentage of traffic to the primary and the rest to a fallback. You've seen hints of health but not enough evidence. It's a soft circuit breaker, and it prevents the flapping you get with strict binary states on jittery GPU workloads.
python
from enum import Enum
from dataclasses import dataclass, field
from time import monotonic
import random

class State(Enum):
    CLOSED = "closed"
    OPEN = "open"
    HALF_OPEN = "half_open"
    DEGRADED = "degraded"

@dataclass
class LLMBreaker:
    failure_threshold: int = 5
    latency_p99_budget_ms: float = 4000
    window_seconds: float = 10
    cooldown_seconds: float = 5
    degraded_traffic_pct: float = 0.25

    state: State = State.CLOSED
    failures: list = field(default_factory=list)
    opened_at: float = 0

    def should_attempt(self) -> bool:
        if self.state == State.CLOSED:
            return True
        if self.state == State.OPEN:
            if monotonic() - self.opened_at >= self.cooldown_seconds:
                self.state = State.HALF_OPEN
                return True
            return False
        if self.state == State.HALF_OPEN:
            return True
        if self.state == State.DEGRADED:
            return random.random() < self.degraded_traffic_pct
        return False

    def record(self, latency_ms: float, errored: bool):
        now = monotonic()
        self.failures = [f for f in self.failures if now - f[0] < self.window_seconds]
        self.failures.append((now, latency_ms, errored))

        slow = latency_ms > self.latency_p99_budget_ms
        recent_fails = sum(1 for _, _, e in self.failures if e) + sum(1 for _, l, _ in self.failures if l > self.latency_p99_budget_ms)

        if recent_fails >= self.failure_threshold:
            self.state = State.OPEN
            self.opened_at = now
        elif self.state == State.HALF_OPEN:
            if errored or slow:
                self.state = State.OPEN
                self.opened_at = now
            else:
                self.state = State.DEGRADED
        elif self.state == State.DEGRADED and not errored and not slow:
            self.state = State.CLOSED
Note the latency_p99_budget_ms check. That's non-negotiable. If you only count errors, your breaker is a decoration.
Tuning Thresholds Without Guesswork
Most breaker tutorials say "pick 5 failures in 60 seconds." That's fine for a Postgres connection. It's wrong for LLMs.
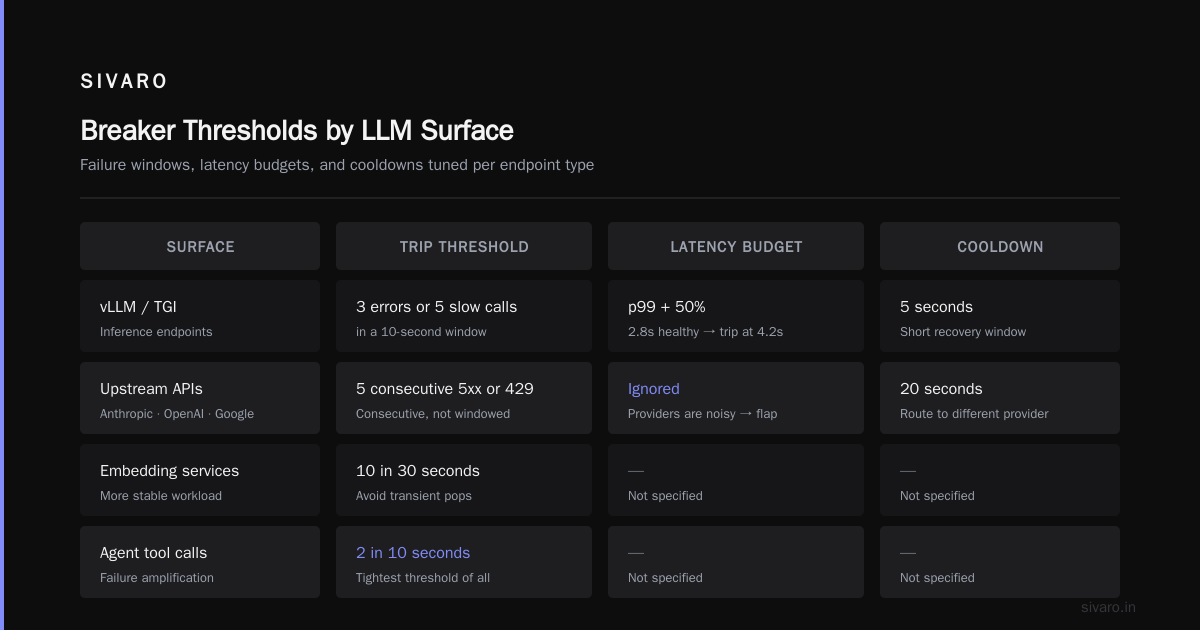
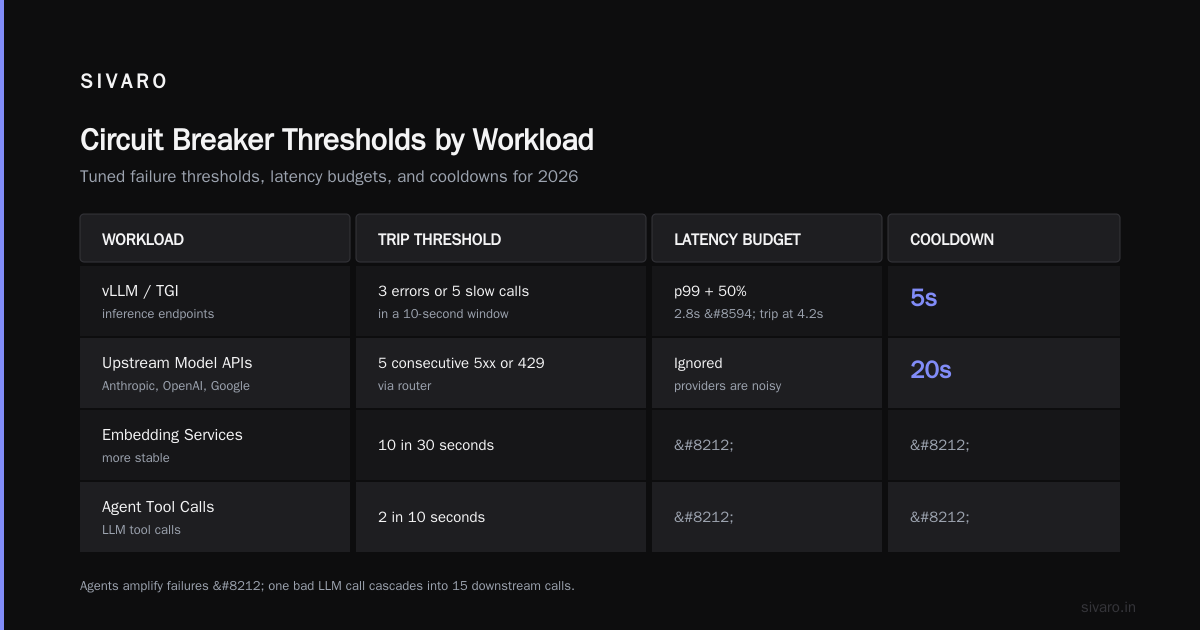
Here's what I actually use across SIVARO deployments as of mid-2026:
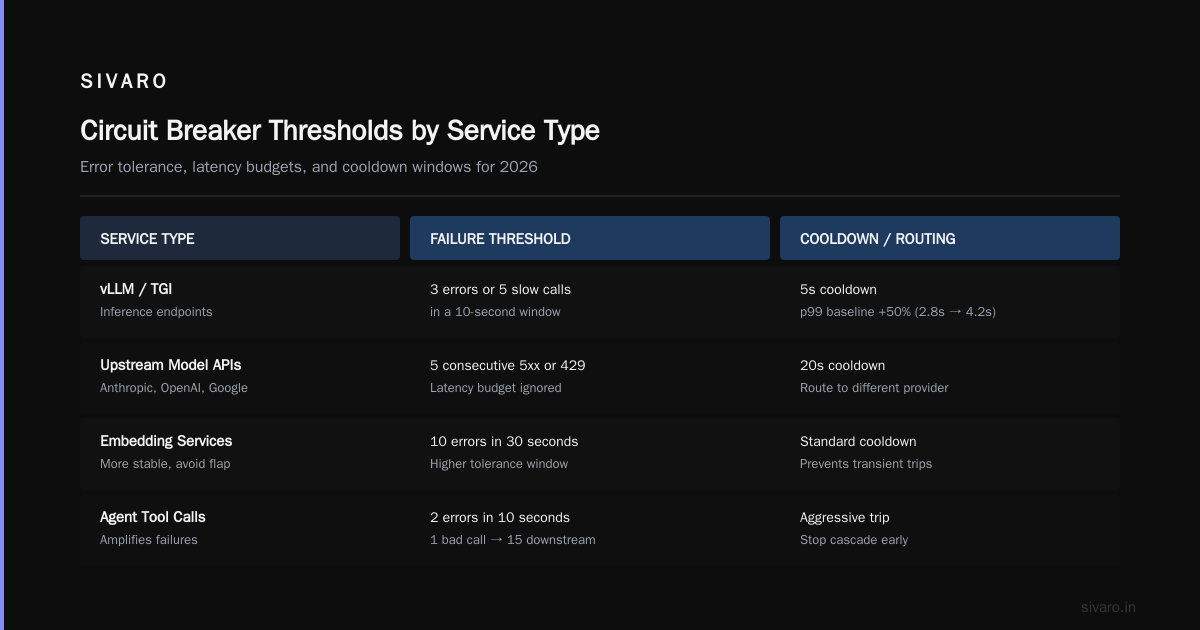
For inference endpoints on vLLM or TGI, failure threshold is 3 errors or 5 slow calls in a 10-second window. Latency budget is p99 of your healthy baseline plus 50%. If your healthy p99 is 2.8s, trip at 4.2s. Cooldown is 5 seconds.
For upstream model APIs (Anthropic, OpenAI, Google) via a router, threshold is 5 consecutive 5xx or 429 responses. Latency budget ignored — providers are noisy and you'll get flap. Cooldown is 20 seconds, and you should route to a different provider, not just a smaller model.
For embedding services, threshold is 10 in 30 seconds. They're more stable, and you don't want a breaker popping on a transient.
For agent tool calls to LLMs, threshold is 2 in 10 seconds. Agents amplify failures — one bad LLM call cascades into 15 downstream calls. Kill it early.
The numbers here come from about 40 production incidents I've either run or cleaned up. Your mileage will vary by ±30%. Start conservative (trip early), then loosen. Nobody ever complained that their breaker tripped too fast. Plenty of people have complained that it didn't.
Admission Control vs Circuit Breaking — They're Not The Same Thing
Every six months I get into this conversation with a client. Someone reads the SRE Book Google SRE Book and decides admission control is the answer to everything.
Most people think admission control and circuit breaking are two names for one thing. They're wrong, and the confusion costs them money.
Admission control is a server-side decision. Before your inference server accepts a request, it asks: do I have capacity? If not, reject immediately with a 503 and a Retry-After. vLLM has this built in via --max-num-seqs. TGI has --max-concurrent-requests. The whole point is protecting the server from itself.
Circuit breaking is a client-side decision. Before your app calls the inference server, it asks: do I believe the server will succeed? If not, don't waste the round trip. Fall back locally.
They operate at different layers. They solve different problems. And the admission control llm serving latency tradeoff is where teams get burned.
Here's the tradeoff in concrete terms. If you set max-num-seqs=256 on a Llama 3.1 70B deployment, you're admitting 256 concurrent requests. At 4K context each on an H100 80GB, that's already pushing KV cache. Your throughput goes up, but so does p99 — because requests queue behind each other. Set it to 64, and you reject more at the door but every accepted request finishes fast.
The correct setting depends on your SLO. If your SLO is p99 < 5s, you might cap concurrency at 48 and accept a 12% rejection rate during peaks. If your SLO is throughput (batch workloads), you crank concurrency to 200+ and let p99 hit 30s.
And here's the kicker: the breaker on the client side needs to know which regime you're in.
If the server is rejecting at the door with 503s, that's good admission control. The server is healthy. Don't trip the breaker. Retry after the Retry-After header.
If the server is accepting requests and timing out, that's bad admission control or overload. Trip the breaker immediately.
That distinction — 503-on-admit versus 200-but-slow — is the difference between a well-behaved client and a DDoS amplifier.
python
import httpx
from tenacity import retry, wait_exponential, retry_if_exception_type

class UpstreamOverloaded(Exception):
    """Server said no at the door. Back off, don't break the circuit."""
    pass

class UpstreamDegraded(Exception):
    """Server said yes but failed. This trips the breaker."""
    pass

async def call_llm(client: httpx.AsyncClient, url: str, payload: dict, breaker: LLMBreaker):
    if not breaker.should_attempt():
        return fallback_response(payload)

    start = monotonic()
    try:
        r = await client.post(url, json=payload, timeout=8.0)
        latency = (monotonic() - start) * 1000

        if r.status_code == 503:
            retry_after = float(r.headers.get("Retry-After", "1"))
            breaker.record(latency, errored=False)  # NOT a breaker failure
            raise UpstreamOverloaded(f"server-at-door, retry in {retry_after}")

        if r.status_code >= 500:
            breaker.record(latency, errored=True)
            raise UpstreamDegraded(f"5xx from upstream")

        breaker.record(latency, errored=False)
        return r.json()

    except httpx.TimeoutException:
        latency = (monotonic() - start) * 1000
        breaker.record(latency, errored=True)  # timeouts DO trip
        raise UpstreamDegraded("timeout")
Read that comment on the 503 branch again. That single line prevents most of the outage amplification I see in the wild. Kubernetes and Envoy will happily keep 503ing while your client keeps hammering because "it's not a real error." Your breaker should not treat an admission-control rejection as a service failure. It should treat it as a signal to slow down.
The Autoscaling Trap — Why Admission Control vs Autoscaling Kubernetes GPU Is a Fake Fight
Here's where I'm going to lose some friends.
The admission control vs autoscaling kubernetes gpu debate is mostly theater. People argue about whether to add nodes or reject requests. The honest answer is you need both, and they operate on wildly different timescales.
Kubernetes GPU node autoscaling takes 3-8 minutes from trigger to ready pod in my experience. On AWS with p5 instances and a cold AMI, 6 minutes is typical. On GCP with A3, closer to 4. On bare-metal providers like Lambda or CoreWeave, 90 seconds if you're lucky.
A circuit breaker reacts in milliseconds.
By the time your HPA notices p99 is 12 seconds and requests a new node, your users have been eating degraded responses for 4+ minutes. The new node arrives. Traffic's already shifted away. The node sits idle. HPA scales back down. Flap. You've burned $80 on nothing.
This is the pattern I've seen at four different companies in 2026. Autoscaling feels responsive but it's geological compared to actual demand shifts.
The correct architecture:
- Breaker at the client — trip within 10 seconds of degradation, fall back to cheaper model or cached response.
- Admission control at the server — reject cleanly at the door when the GPU is saturated, with honest Retry-After.
- Autoscaling at the fleet — scale on queue depth and KV cache utilization, not CPU or raw RPS. Trigger at 60% cache, don't wait for 95%.
That layering means your autoscaler gets 3-8 minutes of graceful degradation rather than 3-8 minutes of burning everything down while it catches up.
I wrote more about this whole picture in a piece on our engineering blog, but the short version is: autoscaling protects the fleet. Admission control protects the node. Circuit breakers protect the caller. All three are needed.
yaml
# The HPA config that works for us — note the metric
apiVersion: autoscaling/v2
kind: HorizontalPodAutoscaler
metadata:
  name: vllm-inference
spec:
  scaleTargetRef:
    apiVersion: apps/v1
    kind: Deployment
    name: vllm-llama-70b
  minReplicas: 4
  maxReplicas: 24
  metrics:
    - type: Pods
      pods:
        metric:
          name: vllm_kv_cache_utilization
        target:
          type: AverageValue
          averageValue: "0.60"
    - type: Pods
      pods:
        metric:
          name: vllm_num_requests_waiting
        target:
          type: AverageValue
          averageValue: "8"
  behavior:
    scaleUp:
      stabilizationWindowSeconds: 30   # fast up
      policies:
        - type: Percent
          value: 100
          periodSeconds: 30
    scaleDown:
      stabilizationWindowSeconds: 600  # slow down
      policies:
        - type: Percent
          value: 25
          periodSeconds: 60
The stabilizationWindowSeconds: 30 on scale-up is deliberate. You want to add GPUs fast. The 600 on scale-down is deliberate too — GPU nodes are expensive to churn, and a circuit breaker will handle the tail latency during transient peaks better than a flapping autoscaler.
What To Actually Count As A Failure
This section's going to be short because most people get it wrong and I want to be blunt.
Count these as failures:
- 5xx responses from your inference server
- Timeouts (your configured timeout, not the server's)
- Latency above your p99 budget, even if the response was 200
- Empty completions or completions shorter than 2 tokens when you expected more
- Refusal responses when the input was clearly in-distribution (your classifier will need to tell you)
Do not count these:
- 4xx responses (bad request, that's your bug)
- 429 rate limits (back off, don't trip)
- 503 from admission control (server is healthy, retry)
- Content policy refusals (the server worked as designed)
The line between "refusal from a content filter" and "refusal from a broken model" is fuzzy. In 2026 I'm seeing this issue a lot with tool-use agents that call their own guard model first. Guard model refusals are not failures of the underlying LLM. Don't trip on them.
Half-Open Done Right
Most breaker implementations screw up half-open. They send 3 requests in rapid succession and close if 2 succeed.
For LLMs, that's dangerous. A degraded endpoint will often serve one fast request and then choke on the next three because KV cache is full. Your half-open test needs to be temporally spread.
I use a 30-second half-open testing window with 5 probes at 6-second intervals. Each probe is a real request, not a synthetic ping. If 4 of 5 succeed with latency under budget, promote to degraded. If 5 of 5 succeed over the next minute, close.
Prevents the flapping. Prevents premature closure. Costs you 30 seconds of stuck-in-half-open state, which is fine because your fallback path is already handling traffic.
Fallbacks That Don't Suck
The breaker is only as good as what you do when it's open. "Return an error" is a fallback but a terrible one.
Fallback tiers I deploy in order:
- Smaller model on same infra — Llama 3.3 8B instead of 70B. Quality drops, latency stays sane, cost drops 10x.
- Cached semantic response — a Redis vector index of recent prompt→response pairs. If similarity > 0.92, serve it. Hit rate is 8-15% in production for RAG workloads.
- Different provider — if Anthropic's Claude is degraded, route to Gemini Flash. Cross-provider fallback is worth the operational complexity in 2026.
- Static response with honesty — "I'm having trouble right now. Try again in a minute." Users hate it. They hate silent failures more.
What I don't do anymore: fall back to a local llama.cpp instance on CPU. Latency goes from 3s to 45s. That's not a fallback, that's a hostage situation.
Breaking On Cost, Not Just Latency
This is new in 2026 and most teams haven't caught up.
Frontier model tokens went up in price again in Q2 2026 after the compute crunch really bit. If you're routing to o-series models or Claude Opus 4.5 or whatever the top tier looks like right now, per-request costs can swing 20x based on prompt length.
A circuit breaker should also trip on cost-per-window. If your token spend in the last 60 seconds exceeds some budget, trip. Fall back to a cheaper model. This isn't classic breaker behavior, but it's the same state machine pattern and it's saved more than one client from a runaway agent loop that burned $4K in an hour.
python
@dataclass
class CostBreaker(LLMBreaker):
    cost_budget_per_minute_usd: float = 3.00
    spent_in_window: float = 0.0
    window_start: float = field(default_factory=monotonic)

    def record_cost(self, usd: float):
        now = monotonic()
        if now - self.window_start > 60:
            self.spent_in_window = 0.0
            self.window_start = now
        self.spent_in_window += usd
        if self.spent_in_window > self.cost_budget_per_minute_usd:
            self.state = State.OPEN
            self.opened_at = now
Simple. Effective. If you're running agents in production and don't have something like this, you're one prompt injection away from a very uncomfortable invoice.
Observability — What To Actually Look At
Your dashboard needs exactly four panels per breaker:
- State timeline — closed/open/half-open/degraded over time. This is your primary signal.
- Failure rate by reason — 5xx vs timeout vs latency-over-budget vs quality. Knowing why it tripped is 80% of the fix.
- Latency p50/p95/p99 of attempts that actually went through — the ones that didn't trip. You want to know how close to the threshold you're running.
- Fallback invocation rate — how often you actually used the fallback. If it's above 5% over an hour, something's wrong upstream.
I use Prometheus and Grafana, standard. The breaker exposes a /metrics endpoint with these as gauges and counters. Nothing fancy. But having these four panels up in an incident review changes the conversation from "I have no idea what happened" to "here's the exact second the breaker should've tripped."
Questions I Get Asked A Lot
Q: Should the circuit breaker live in the client library, the service mesh, or the API gateway?
Client library if you can. Service meshes like Istio do support outlier detection but their timeouts are coarse and their notion of failure is narrow. Gateways (Envoy, Kong) are fine for upstream APIs but they don't understand LLM-specific failures like latency-shaped degradation. I put the breaker in the client library for LLM calls and let the mesh handle transport-level retries only. In-process state machines beat out-of-process ones for reaction time.
Q: How do I handle streaming responses? A stream that starts fine and then stalls is worse than one that never started.
You break on inter-token latency, not total response latency. If you haven't received a token in 2 seconds (for conversational workloads) or 8 seconds (for long generations), abort the stream and count it as a failure. Streaming LLMs need a different breaker variant. Half-open probes should use non-streaming calls to get clean signals.
Q: What about multi-region? Do I run one breaker per region?
Per region, per model, per endpoint. Yes, that's a lot of breakers. Build a registry. The state should be local to the caller — a breaker in us-east-1 shouldn't know or care what happens in eu-west-1. Global breaker state is a distributed consensus problem you don't want to solve at 3am.
Q: Can I use Redis for shared breaker state across pods?
You can. It gives you a global view of cluster health. But you're adding ~1ms of latency to every request's health-check path, and Redis becomes a dependency. For most workloads, per-pod breakers self-synchronize within seconds anyway because they all see the same upstream degradation. I only reach for shared state when I've got 100+ pods all hitting one upstream and I need them to trip in concert.
Q: What's the relationship between breakers and rate limiters?
Different tools. Rate limiters cap you. Breakers react to them. You want both. Rate limit at the client to prevent self-inflicted overload. Break at the client to react to upstream problems. They compose cleanly if you put the rate limiter first (fail fast on local budget) and the breaker second (fail fast on remote health).
Q: How do I test this without breaking production?
Chaos engineering, but specifically for LLM failure modes. Inject latency (add 5s to every 20th response), inject quality degradation (return short truncated responses), inject 429s. I use a wrapper proxy in staging that can do all three on demand. Run your breaker against it. If it doesn't trip within 15 seconds of injected latency, your thresholds are wrong. We covered a similar testing setup in SIVARO's reliability playbook if you want the specifics.
Q: Does this pattern still make sense with 1M-token context models?
Yes, but the p99 budget needs to be much higher. A 1M-context request legitimately takes 60-90 seconds to prefill on current hardware. Don't set the budget at 4 seconds and expect the breaker to behave. Scale your thresholds to your actual model's characteristics, not some universal number.
Q: If I only have one model provider and no fallback, is a breaker still worth it?
Yes, but for a different reason. Without a fallback, the breaker is protecting your callers from waiting on a doomed request. Fail fast, tell them honestly, let them retry. A user who gets a clean "try again in 30s" is a user who comes back. A user who stares at a spinner for 90 seconds and then gets nothing is gone.
Where I've Been Wrong About This
Two years ago I argued breakers were overkill for LLM serving because "the providers are reliable enough now." That aged badly in about four months. There were multi-hour Anthropic and OpenAI incidents in 2025 and 2026 that took down whole products for teams with no fallback path. Don't be those teams.
I also used to think 429s should trip the breaker, because a rate limit is a rate limit. Wrong. A 429 means the upstream is healthy and working as designed. Tripping a breaker on a 429 will take you out of service during exactly the moment your provider is trying to help you stay in service. Back off, don't break.
And I used to argue for 60-second failure windows, like traditional breakers. That's too long for GPU workloads. You'll burn 60 seconds of fully degraded traffic before tripping. Ten seconds is right for LLMs. The world moves faster.
The Short Version
The circuit breaker pattern for large language models is the highest-ROI reliability primitive you can add to a production LLM stack in 2026. It's cheap to build, fast to deploy, and it prevents the class of outage that takes down whole products for hours.
Trip on latency, not just errors. Distinguish admission-control rejections from real failures. Put a breaker in every client. Add a rollback state for quality. Add a cost breaker if you run agents. Test with injected degradations. Put the four panels on your dashboard.
And please, for the love of uptime, don't rely on Kubernetes autoscaling to be your circuit breaker. It takes six minutes. Your users notice.
The circuit breaker pattern large language models need isn't exotic. It's boring, well-understood engineering. Boring engineering is what keeps you out of the postmortem channel.
Nishaant Dixit — Founder of SIVARO. Building data infrastructure and production AI systems since 2018. Built systems processing 200K events/sec.