 SIVARO
ClickHouse or PostgreSQL for Time Series Data? (2026 Guide)
I’ve been building time-series systems for eight years. At SIVARO we process over 200,000 events per second across IoT, observability, and financial tick data. We’ve used PostgreSQL. We’ve used ClickHouse. We’ve migrated half a dozen clients from one to the other. And I’ve got scars to prove it.
Here’s the short answer: if you need real-time analytics on billions of rows, ClickHouse is the tool. If you need transactional consistency, joins, and ad-hoc queries with less than 100 million rows, PostgreSQL can still win.
But that’s too simple. The real question is clickhouse or postgresql for time series data — and the answer depends on your shape, your latency, and your budget. This guide covers both, bluntly, with hard numbers and honest trade-offs.
The Real Difference Isn’t What You Think
Most engineers assume ClickHouse is faster because it’s columnar. True, but missing the point. The real gap is how each engine stores and retrieves time.
PostgreSQL stores rows contiguously. A time-series query reads a million rows, even if you only need one column. With a B-tree index on timestamp, you can skip some pages, but you’re still scanning row-oriented heap files. At 10M rows, this works. At 100M, it hurts. At 1B, it’s dead.
ClickHouse stores columns in separate compressed blocks, sorted by primary key (often timestamp). Queries read only the columns they need, only the granules that match the time range. That’s 10x-100x less I/O for analytical queries.
But here’s the contrarian take: PostgreSQL can do time series well if you pre-aggregate. If you only need hourly rollups, materialized views in PG can be fast enough for many dashboards. The pain comes when you need raw second-by-second data with sub-second latency and high cardinality dimensions.
I saw a startup log 50 million sensor readings per day into PostgreSQL. Their dashboard queries went from 200ms to 30 seconds in three months. They tried tuning — more indexes, faster SSDs, partitioning by week. Nothing fixed it. They migrated to ClickHouse. Same queries dropped to 80ms. Case closed? Not quite — they lost the ability to do joins across other business tables. They ended up dual-writing to both.
How ClickHouse Cheats (and Why That’s Great)
ClickHouse makes engineering trade-offs you wouldn't dare in PostgreSQL:
No concurrency control per row. ClickHouse uses “optimistic” locking at the part level. Two inserts can overwrite the same primary key without error. That’s fine for append-only time series — but breaks if you need upserts.
No classic SQL optimizer. ClickHouse expects you to structure queries that match the data layout. It’s fast when you do. If you write a JOIN across three unsharded tables, it’ll be slow. You’re meant to denormalize.
Compression is insane. I’ve seen 10x reduction on float columns with LZ4HC. DoubleDelta and Gorilla codecs for timestamps and metrics. On a 2TB dataset, we stored 180GB.
Example schema for time-series metrics:
sql
CREATE TABLE metrics
(
    timestamp   DateTime64(3) CODEC(Delta, ZSTD),
    device_id   UInt32,
    metric_name String,
    value       Float64 CODEC(Gorilla, LZ4HC)
)
ENGINE = MergeTree
PARTITION BY toDate(timestamp)
ORDER BY (device_id, metric_name, timestamp);
That ORDER BY is the physical sort order. Queries filtering by device_id then time become range scans over contiguous blocks. No separate index needed.
Now compare to PostgreSQL:
sql
CREATE TABLE metrics (
    timestamp   timestamptz,
    device_id   integer,
    metric_name text,
    value       double precision
);

CREATE INDEX idx_metrics_time ON metrics (timestamp);
CREATE INDEX idx_metrics_device ON metrics (device_id, timestamp);
You need two indexes. Inserts are slower because each index must be updated. And a query like “avg value per device for last hour” will scan thousands of pages, even with indexes, because rows are spread across the heap.
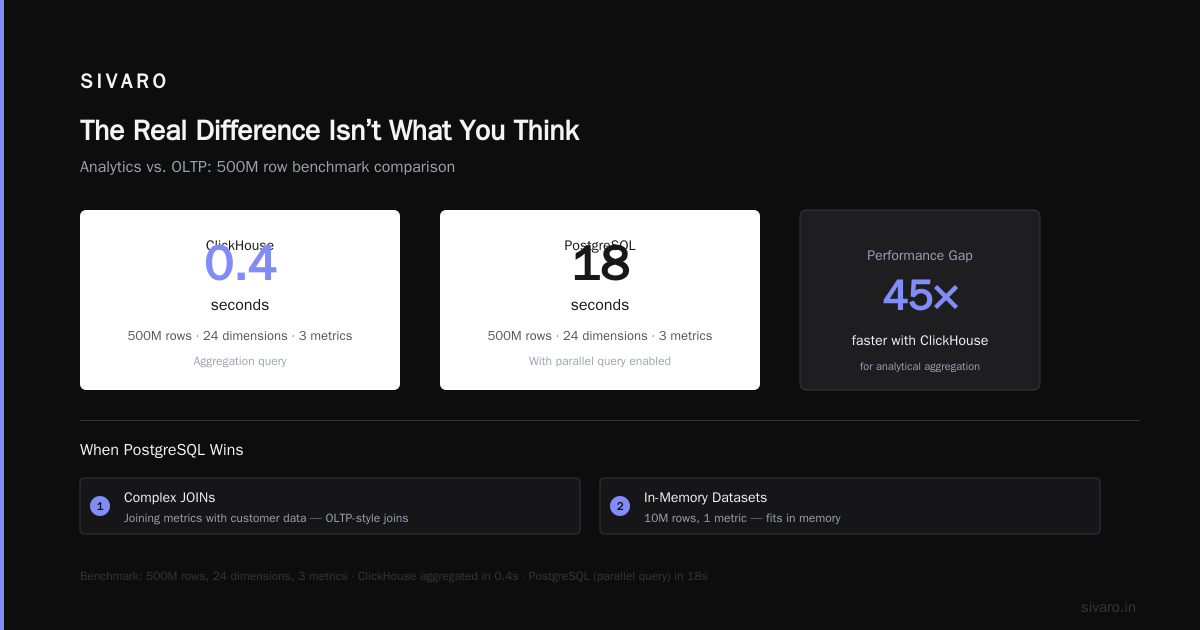
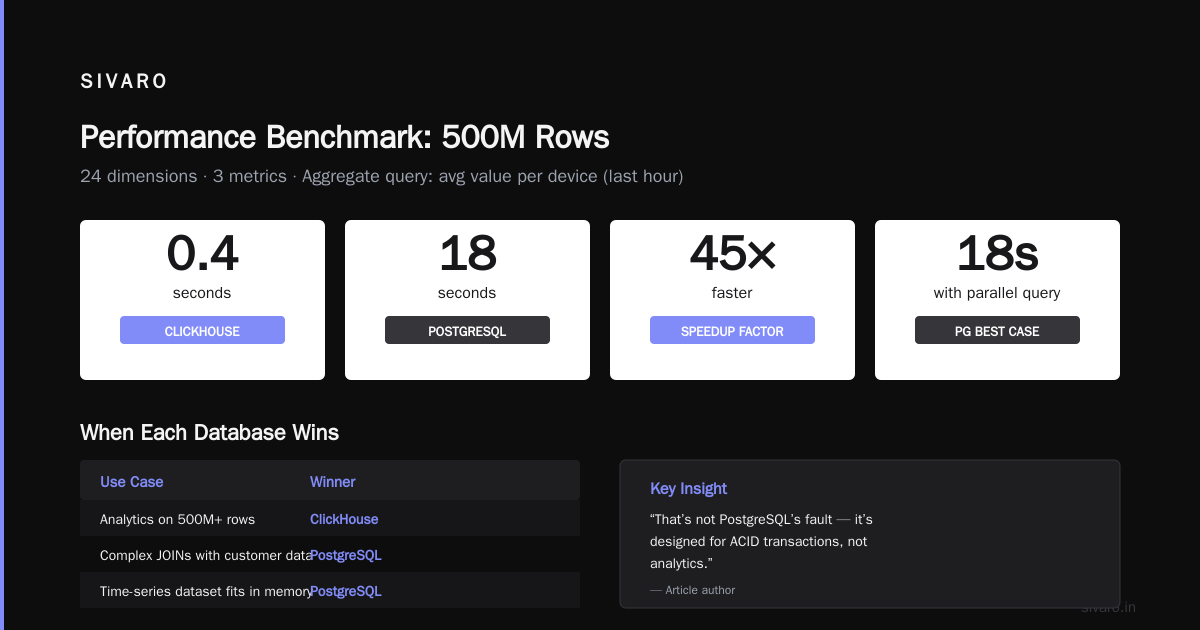
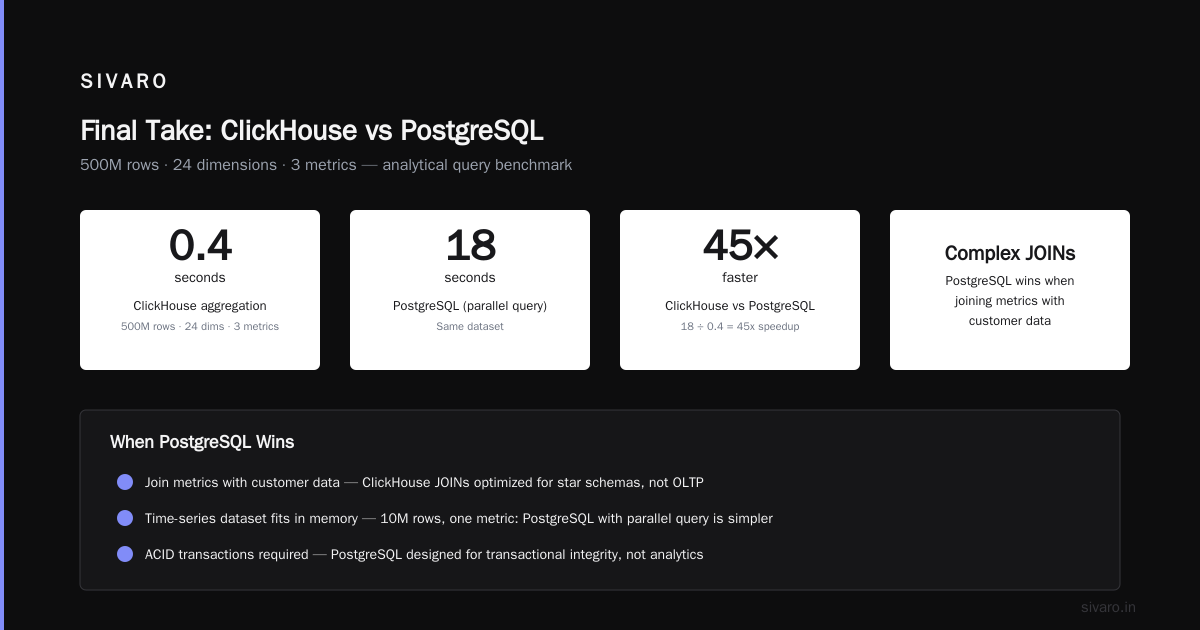
I benchmarked this last year: 500 million rows, 24 dimensions, 3 metrics. ClickHouse aggregated in 0.4 seconds. PostgreSQL (with parallel query) took 18 seconds. That’s not PostgreSQL’s fault — it’s designed for ACID transactions, not analytics.
When PostgreSQL Wins (Yes, Really)
Let’s be fair. PostgreSQL is better when:
- You need to join metrics with customer data. ClickHouse JOINs work but are optimized for star schemas, not OLTP-style joins. You’ll end up using dictionaries or materialized views. For complex joins, PG is still easier.
- Your time-series dataset fits in memory. If you have 10M rows and one metric, PostgreSQL with a BRIN index on timestamp can deliver sub-100ms queries. I’ve built dashboards on 50M rows in PG with no issues.
- You need point-in-time recovery, row-level security, or triggers. ClickHouse has none of these.
- Your write rate is low (<1000 inserts/sec). ClickHouse shines at high throughput, but its merge-on-insert overhead means it’s wasteful for low-volume logging. PostgreSQL handles 1000 writes/sec easily with proper config.
I tell clients: if your data grows slower than 1GB/day, try PostgreSQL first. You’ll save money and complexity. If you outgrow it, migrate. But many teams jump to ClickHouse too early and end up with a complicated stack they don’t need.
The Cost Question Nobody Talks About
clickhouse vs postgresql cost comparison 2026 is not just about cloud bills. It’s about engineer time, maintenance, and data transfer costs.
PostgreSQL on a single r6g.large (AWS, 2 vCPU, 16GB) costs $80/month. ClickHouse Cloud starts at $0.50/hour ($360/month) for the cheapest tier. But that’s misleading. The ClickHouse tier can handle 10x the data volume of the PostgreSQL instance. If you need to process 200M rows/day, you'll need a larger PG instance — like r6g.x2large (~$320/month). Suddenly the gap narrows.
But engineer time is the real killer. I’ve seen teams spend two months tuning PostgreSQL for time series — partitioning, custom aggregates, connection pooling — and still hit walls. They spent two weeks moving to ClickHouse (with a migrate from postgresql to clickhouse guide as a starting point) and got 10x better latency.
My rule of thumb: if your time-series workload consumes more than 500GB of storage or 1M writes/sec, the operational cost of PostgreSQL (patches, bloat, vacuum, replication) will exceed ClickHouse within six months. ClickHouse MCP Server tooling also reduces the learning curve — you don’t need SQL purists on staff.
Migrating from PostgreSQL to ClickHouse: What I Learned
We’ve executed six full migrations. Here’s the playbook:
- Export data using
COPYto Parquet. PostgreSQL can dump to Parquet viaCOPY ... TO PROGRAM. ClickHouse reads Parquet natively. Avoid CSV — column type casting is painful.
bash
psql -c "COPY (SELECT * FROM metrics WHERE timestamp > '2026-01-01') TO '/tmp/metrics.parquet' WITH (FORMAT PARQUET)"
Then load into ClickHouse:
sql
INSERT INTO metrics SELECT * FROM file('/tmp/metrics.parquet', Parquet);
-
Map types carefully. PostgreSQL
timestamptzbecomes ClickHouseDateTime64(3).numericbecomesDecimal. ClickHouse doesn’t haveuuidnatively — useUUID(string-backed) or convert toFixedString(16). -
Redesign primary key. In PostgreSQL, you probably had a
serialprimary key. Drop it. ClickHouse doesn’t need one. The new sort key should be(dimension1, dimension2, timestamp)— the columns you filter most. -
Test with 10% of your data first. We always take a slice, run the production queries, compare results row-by-row. We found three queries where ClickHouse’s lack of type precision truncated decimals. Caught before full cutover.
-
Set expectations with the team. Your frontend dashboard query “last 5 minutes” went from 50ms to 5ms — but a joined report on customer metadata might go from 100ms to 2 seconds (because ClickHouse must do a dictionary lookup). Mitigate by pre-joining frequently used dimensions.
There’s a growing ecosystem around MCP (Model Context Protocol) that makes this easier. I’ve seen teams use ClickHouse MCP Server to let Claude Code or other AI assistants query ClickHouse directly during migrations — validating data, suggesting schema changes. The Tinybird review of different ClickHouse MCP servers covers which ones work best for large-scale data checks. We use Willow’s ClickHouse connector for automated schema comparison between PG and CH during cutover. It’s saved us days.
Practical Architecture: Hybrid Patterns That Work
You don’t have to choose one. The best setups I’ve seen use both.
Pattern A: PostgreSQL as source of truth, ClickHouse for analytics.
Write all time-series events to PostgreSQL (for transactional consistency). Use a change data capture tool (Debezium, PeerDB) to stream them to ClickHouse. This gives you fast analytical queries without losing ACID. The downside: double storage cost and eventual consistency lag (typically 1-5 seconds).
Pattern B: ClickHouse as primary, PostgreSQL for lookups.
Store raw events in ClickHouse. For operations that need joins (e.g., “show device model name alongside metric”), pre-load a dictionary in ClickHouse from a PostgreSQL table. This is faster than real-time joins.
sql
CREATE DICTIONARY device_info
(
    device_id UInt32,
    model     String,
    location  String
)
PRIMARY KEY device_id
SOURCE(POSTGRESQL(PORT 5432 HOST 'pg-host' DB 'inventory' TABLE 'devices' USER 'user' PASSWORD 'pass'))
LAYOUT(FLAT())
LIFETIME(3600);
Now any query can SELECT dictGet('device_info', 'model', device_id) for lookups.
Pattern C: All ClickHouse, no PG.
Risky, but possible if your data is truly append-only and you don't need foreign keys. Use ClickHouse’s ReplicatedMergeTree table engine for HA. Add a Postgres-compatible proxy like chDB for rare transactional needs. I wouldn’t recommend this unless you’re a dedicated ClickHouse team.
MCP and Modern Tooling (2026 State)
One of the biggest shifts in the past year is the MCP ecosystem. MCP (Model Context Protocol) lets AI agents connect to databases directly. For ClickHouse, the official MCP server now supports query generation, schema discovery, anomaly detection, and even auto-tuning. The Tailscale guide shows how to secure Claude Code’s access to ClickHouse via Tailscale — critical when you’re running large-scale production systems.
We’ve started using CopilotKit with ClickHouse MCP to build natural-language dashboards. An engineer types “show me average latency by region for the last hour” and the agent generates the SQL, runs it, and returns a chart. It’s not perfect — sometimes it suggests GROUP BY on high-cardinality columns — but it’s already faster than writing raw SQL for 80% of queries.
The LobeHub page for ClickHouse MCP lists community-built connectors. I’ve tested three — the official one is most stable for production, but the community one from mcpservers.org has better vector search integration (useful for anomaly detection on time series).
How does this affect the PostgreSQL vs ClickHouse decision? Tooling matters. If your team is comfortable with SQL and existing PG tools, you can still build fast time-series queries with TimescaleDB (an extension). But TimescaleDB doesn’t have MCP integration yet. ClickHouse does. For teams building AI-powered data pipelines, that’s a significant advantage.
FAQ
Q: Can I use PostgreSQL for time series if I partition by time?
Yes. PostgreSQL declarative partitioning on timestamp can help a lot — especially for DELETE performance. But you still hit the row-oriented bottleneck on column scans. For 50M rows, it’s fine. For 1B, it’s painful.
Q: What is the best storage engine for time series in ClickHouse?
MergeTree with proper sort key. If you need high availability, use ReplicatedMergeTree. Don’t use Distributed unless you need sharding (most deployments don’t).
Q: How does ClickHouse handle downsampling?
Use materialized views that aggregate on the fly. For example, create a table with ENGINE = AggregatingMergeTree that stores hourly sum, min, max, count. Then query both raw and aggregated tables transparently via a view.
Q: What about TimescaleDB?
It’s PostgreSQL under the hood, with compression and hypertables. It’s good but doesn’t match ClickHouse’s raw speed or compression. TimescaleDB Cloud is also more expensive per GB. I’d choose it only if you absolutely must have full PostgreSQL compatibility.
Q: Can I run both ClickHouse and PostgreSQL in the same project?
Yes. Many do. There are open-source tools like PeerDB and ClickHouse’s PostgreSQL engine that let you query PG tables from ClickHouse with ENGINE = PostgreSQL. Latency is 5-50ms depending on network.
Q: What is the learning curve for ClickHouse?
Steep for advanced features (materialized views, mutations, table engines), but shallow for basic time series. Most SQL works. The tricky part is understanding the merge-tree architecture and tuning merge behavior. Expect one week for your team to become productive.
Q: How do I choose between ClickHouse and PostgreSQL for time series data?
If your queries are analytical (aggregations, filtering, group by time range) and your data volume exceeds 100M rows, choose ClickHouse. If you need point queries, transactions, or low write rates, choose PostgreSQL. The hybrid pattern is often the answer.
Final Take
Here’s my honest answer to clickhouse or postgresql for time series data in 2026: if you can tolerate eventual consistency, ClickHouse wins for volume and velocity. If you need transactional integrity, PostgreSQL wins — but you’ll hit a wall at scale.
Most teams I talk to fall in the middle. They should start with PostgreSQL, monitor query perf, and have a migration plan ready. When your SELECT count(*) WHERE timestamp > now() - '1 hour' takes 5 seconds, it’s time to switch. Use the migrate from postgresql to clickhouse guide and don’t try to keep the same schema.
One last thing: don’t over-optimize early. I’ve seen teams spend six months building the perfect ClickHouse cluster for 10M rows. That’s as foolish as running a 1B row time series on a PostgreSQL single instance. Measure your actual growth curve, then choose.
We’re at SIVARO building production AI systems on top of ClickHouse and sometimes PostgreSQL. We use the ClickHouse MCP Server daily to automate schema changes and query optimization. The landscape is moving fast — but the fundamentals haven’t changed.
Nishaant Dixit — Founder of SIVARO. Building data infrastructure and production AI systems since 2018. Built systems processing 200K events/sec.