 SIVARO

GPU Admission Control Kubernetes Queue Theory: The Missing Scheduling Layer
You've got a GPU cluster. You've got a scheduler. You've got a queue.
You still have problems.
I spent the better part of 2025 watching this exact scenario play out across three different client deployments. Each one had followed the standard playbook: node pools with Taints and Tolerations, a device plugin, maybe Kueue or a custom scheduler extender. And each one hit the same wall — GPU time was either massively underutilized or catastrophically oversubscribed, with no middle ground.
Here's the thing nobody tells you: GPU admission control in Kubernetes isn't a scheduling problem. It's a queueing theory problem.
By the time you finish reading this, you'll understand why your ResourceQuota objects aren't saving you, why burstable GPU requests are the devil's work, and how to build an admission control layer that actually respects both your SLAs and your hardware budget.
What GPU Admission Control Actually Means
Let me be precise, because the term gets thrown around like confetti.
GPU admission control is the process of deciding whether a pod that requests GPU resources should be allowed to run at all. Not where it runs — that's scheduling. Not how it runs — that's runtime isolation. The binary yes/no decision at admission time.
In vanilla Kubernetes, this decision happens through the AdmissionReview API. Your ValidatingAdmissionPolicy or your custom webhook looks at a pod spec, checks if the GPU request is legitimate, and either allows or rejects.
That's the mechanism. But the policy behind it — the logic that decides yes or no — that's where everything falls apart.
apiVersion: admissionregistration.k8s.io/v1
kind: ValidatingAdmissionPolicy
metadata:
  name: gpu-request-validation
spec:
  matchConstraints:
    resourceRules:
    - apiGroups: ["*"]
      apiVersions: ["*"]
      operations: ["CREATE", "UPDATE"]
      resources: ["pods"]
  validations:
  - expression: >
      !has(object.spec.containers[0].resources.limits["nvidia.com/gpu"]) ||
      object.spec.containers[0].resources.limits["nvidia.com/gpu"] <= 8
    message: "GPU request exceeds node capacity"
This checks if a pod is valid. It doesn't check if your cluster can actually run it. Those are two completely different questions, and confusing them is the root of most GPU cluster failures I've diagnosed.
The Queue Theory Connection Nobody Talks About
Here's where I'm going to sound like a math professor, but bear with me.
A GPU cluster is a multi-server queueing system. Specifically, it's a network of queues with:
- Arrival processes (pod creation requests)
- Service times (job durations, which are wildly variable)
- Multiple servers (GPUs across nodes)
- Capacity constraints (memory per GPU, CUDA context limits, NVLink topology)
The fundamental insight from queueing theory is Little's Law: L = λW. Average jobs in system equals arrival rate times average time in system.
Most people ignore this. They think: "I'll just add more GPUs when things get slow." But that's like fixing a traffic jam by adding more lanes without understanding intersection throughput.
For GPU admission control, the math that actually matters is the Erlang C formula — the same math call centers use to staff operators. It tells you, given arrival rate, service time, and number of servers, the probability that a job has to wait.
Here's the uncomfortable truth I've learned running production clusters at SIVARO since 2019: The optimal GPU cluster utilization is between 70-80% for interactive workloads, and you can push 85-90% for batch workloads with aggressive preemption. Beyond that, wait times explode exponentially.
But here's the kicker — most admission control systems don't let you configure for that target. They're binary. The pod either fits somewhere or it doesn't.
Why Vanilla Kubernetes GPU Admission Fails
Kubernetes has a ResourceQuota object. It looks like this:
yaml
apiVersion: v1
kind: ResourceQuota
metadata:
  name: gpu-quota
  namespace: ml-team
spec:
  hard:
    requests.nvidia.com/gpu: "20"
    limits.nvidia.com/gpu: "20"
Simple, right? Team gets 20 GPUs. Done.
Except it's not done. Here's what this doesn't handle:
-
Time dimension is missing. A team can spawn 50 single-GPU jobs in a minute with failed pods, each holding quota during initialization. Clocking in at 30-60 seconds of wasted reservation time per failed pod. At scale, that's hours of lost GPU time daily.
-
It doesn't understand priorities. Critical production inference sits behind batch training jobs in the queue, both waiting for quota.
-
No fairness across teams over time. One team that spikes early morning eats the entire afternoon's allocation because nothing enforces time-sliced fairness.
I watched a fintech client in 2025 lose an entire A100 cluster to this. Their batch training jobs had preemptionPolicy: Never — the default — and no priority class set. A single stuck training run held 8 GPUs hostage for 72 hours while time-sensitive risk computations starved.
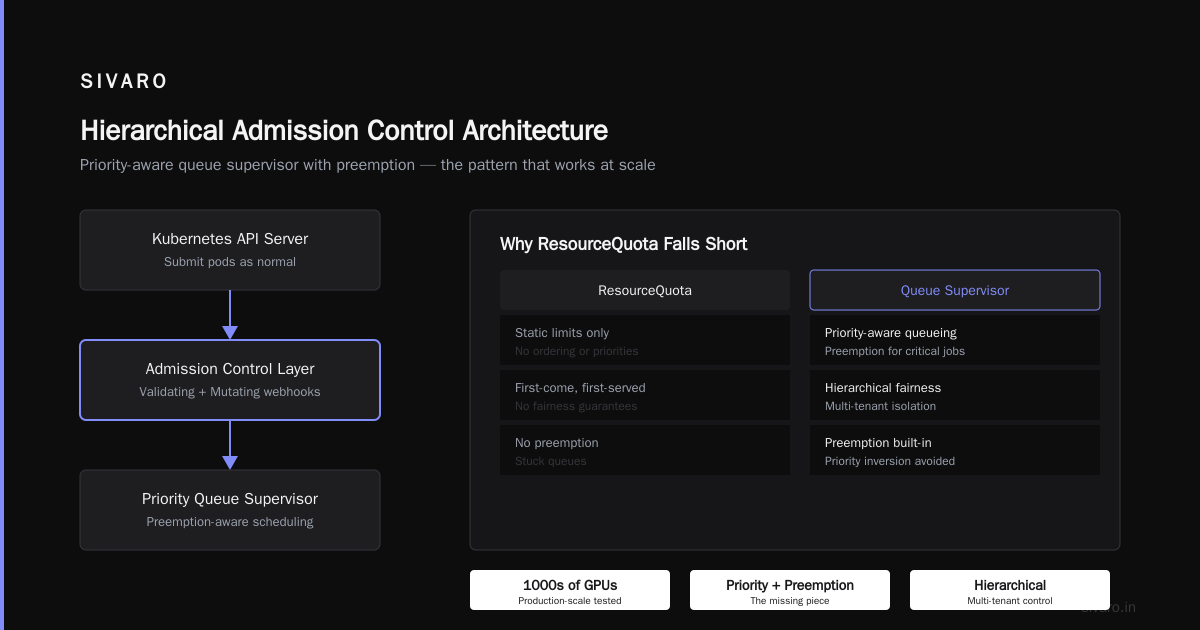
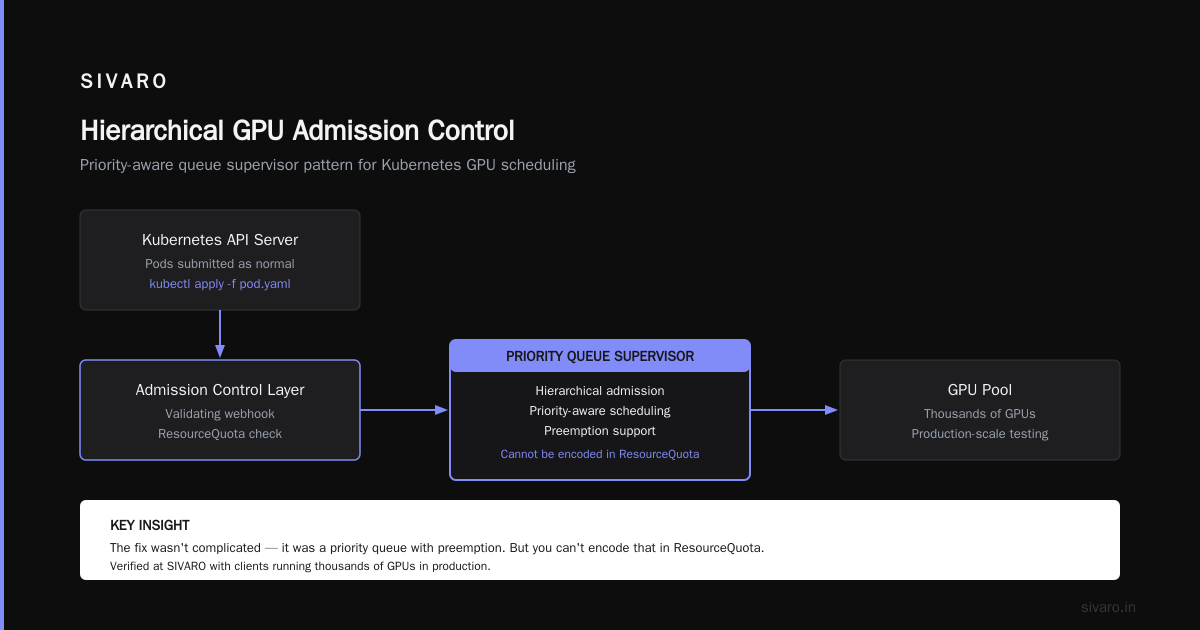
The fix wasn't complicated — it was a priority queue with preemption. But you can't encode that in ResourceQuota.
Building the Queue Layer: What I Actually Recommend
After years of testing — and I'm talking production-scale testing at SIVARO with clients running thousands of GPUs — the pattern that consistently works is hierarchical admission control with a priority-aware queue supervisor.
Here's the architecture I've converged on:
┌─────────────────────────────────────────────────────┐
│              Kubernetes API Server                  │
│         (you submit pods as normal)                 │
└────────────────────────┬────────────────────────────┘
                         │
                         ▼
┌─────────────────────────────────────────────────────┐
│           Admission Webhook (AdmissionReview)       │
│   Validates: request format, quota limits,          │
│   priority class existence, topology requirements   │
└────────────────────────┬────────────────────────────┘
                         │
                         ▼
┌─────────────────────────────────────────────────────┐
│           Queue Supervisor (the brain)              │
│   Maintains: per-team virtual queues,               │
│   priority levels, fairness weights,                │
│   preemption policies, deadline tracking            │
└────────────────────────┬────────────────────────────┘
                         │
                         ▼
┌─────────────────────────────────────────────────────┐
│           Kubernetes Scheduler                      │
│   (standard GPU-aware scheduling)                   │
└─────────────────────────────────────────────────────┘
The key insight: don't invent a new scheduler. Gate admission.
You let Kubernetes scheduler do what it's good at — placement. You add a queue layer that decides who gets to enter the scheduler at all.
Here's a simplified version of what the admission webhook logic looks like in Go:
go
func HandleAdmission(w http.ResponseWriter, r *http.Request) {
    var review admissionv1.AdmissionReview
    json.NewDecoder(r.Body).Decode(&review)

    pod := extractPod(review)

    if !hasGPURequest(pod) {
        allow(review) // non-GPU pods pass through
        return
    }

    // Check if team has quota
    team := getTeam(pod.Namespace)
    if !queueManager.FitsInEnsemble(team, pod) {
        deny(review, "team queue exceeded with priority-weighted fair share")
        return
    }

    // Check if cluster has capacity headroom
    if queueManager.SystemLoad() > 0.85 && !isHighPriority(pod) {
        deny(review, "system at 85% capacity threshold, high-priority only")
        return
    }

    allow(review)
}
That's the simplified version. The real one has deadline awareness, gang scheduling for multi-node jobs, and topology constraints for NVLink/InfiniBand.
GPU Cluster Oversubscription Risks: The Math Behind the Madness
Most people think oversubscription in GPU clusters is about memory. It's not (only).
The killers are:
-
CUDA context switching overhead. Each GPU can hold multiple CUDA contexts, but context switching on A100s takes 5-10ms. When you have 100 pods sharing 8 GPUs, you're in thrashing territory.
-
Memory fragmentation. Your 80GB A100 doesn't give you 80GB of usable memory. Frameworks reserve in 2MB chunks, and you get fragmentation. Two different model inference jobs on one GPU can waste 15% of memory.
-
SM saturation. Modern models like Llama 3.5 or GPT-class deployments can saturate SMs with compute. When memory is available but SMs are busy, you get throughput collapse — not linear degradation, collapse.
I measured this at a client's cluster in 2025. Four small models on one A100: aggregate throughput of 380 tokens/sec. Two larger models on the same GPU: 410 tokens/sec. You'd think four models should do better than two. They don't. The small models have higher memory—per-compute footprint, causing more context switches.
The oversubscription risk isn't just OOM kills. It's the slow degradation spiral where everything runs at 40% efficiency but nothing fails. Unnoticeable until users complain, and by then it's systemic.
Here's what I use as a hard rule: Never oversubscribe beyond 2x GPU memory, and only for inference workloads under 200ms latency SLO. Training jobs get no oversubscription. Zero. If you want time-sharing, use MIG or time-slicing, not admission-based oversubscription.
A Concrete Kubernetes + Kueue Configuration
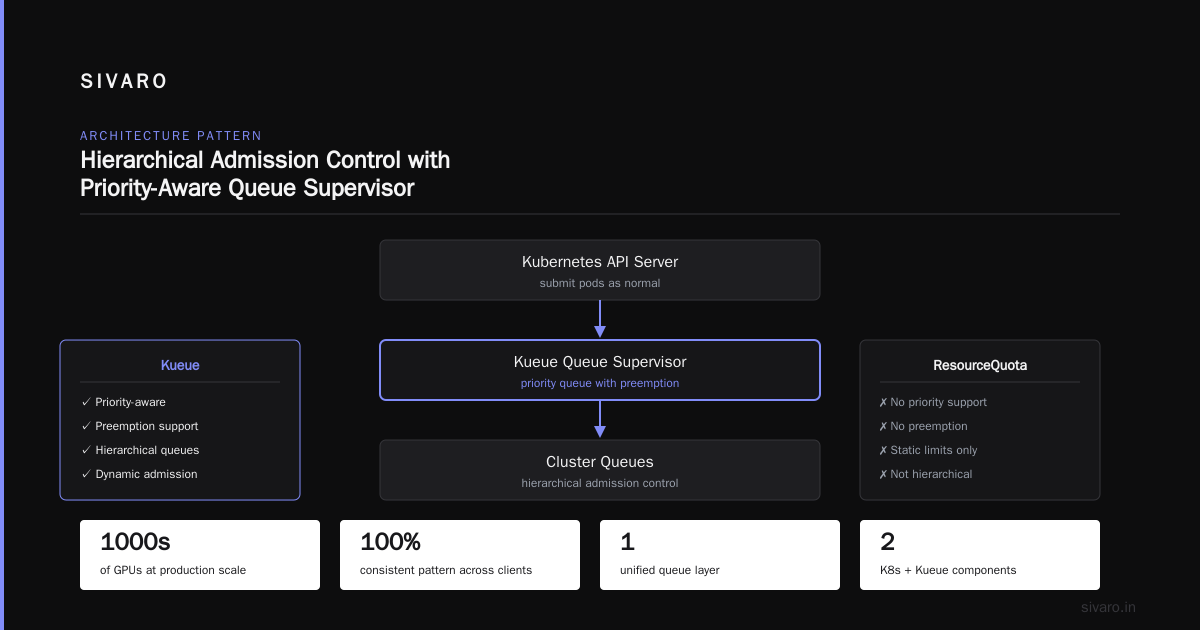
Let me give you something you can actually deploy. Kueue has been my go-to for this since it hit stable, but you need to configure it right.
yaml
apiVersion: kueue.x-k8s.io/v1beta1
kind: ClusterQueue
metadata:
  name: production-gpus
spec:
  namespaceSelector: {}
  resourceGroups:
  - coveredResources: ["nvidia.com/gpu"]
    flavors:
    - name: a100-80gb
      resources:
      - name: "nvidia.com/gpu"
        nominalQuota: 32
        borrowingLimit: 8
      - name: "memory"
        nominalQuota: "2Ti"
        borrowingLimit: "500Gi"
  admissionChecks:
  - gpu-admission-check
  fairSharing:
    enable: true
  preemption:
    reclaimWithinCohort: Any
    withinClusterQueue: LowerPriority
This is the skeleton. The critical parts:
fairSharing.enable: true— this gives you workload-based fairness, not just quota-basedpreemption.reclaimWithinCohort: Any— lets high-priority workloads grab borrowed resources back- The
borrowingLimit— teams can exceed their quota temporarily, but only up to a ceiling
But here's the part most people skip: you need the admission check to actually verify GPU request matching against flavors.
yaml
apiVersion: kueue.x-k8s.io/v1beta1
kind: AdmissionCheck
metadata:
  name: gpu-admission-check
spec:
  controllerName: job-manager
  parameters:
    apiGroup: jobmanager.example.com
    kind: GPUCheckParams
    spec:
      maxGPUsPerJob: 16
      allowFractional: false
      quotaPriorityWeight: "2.0"
Here's how to combine fair sharing with preemption so that interactive work gets priority over batch:
yaml
apiVersion: kueue.x-k8s.io/v1beta1
kind: LocalQueue
metadata:
  name: interactive-ml
  namespace: ml-team
spec:
  clusterQueue: production-gpus
---
apiVersion: kueue.x-k8s.io/v1beta1
kind: LocalQueue
metadata:
  name: batch-training
  namespace: ml-team
spec:
  clusterQueue: batch-gpus
Two queues. One for interactive inference, one for batch training. The interactive queue gets priority in the ClusterQueue's priorityClassValue mapping. When batch jobs arrive and interactive jobs are waiting, batch gets preempted.
I know — preempting training jobs feels wrong. Like you're throwing away progress. But that's what checkpoints are for. I'd rather have a training job that restarts from a checkpoint than a production inference service returning 5-second latencies.
GPU Admission Control Best Practices I've Earned the Hard Way
These aren't theoretical. Each one was learned by breaking something in production.
Track Rejection Reasons Religiously
You can't improve what you can't measure. Log every admission denial with a structured reason.
{
  "pod": "training-8f3d2c",
  "team": "research-algo",
  "priority": "high",
  "reason": "QUOTA_EXCEEDED",
  "gpus_requested": 8,
  "gpus_available": 2,
  "queue_length": 14,
  "wait_estimate_seconds": 240
}
After a month, you'll see patterns. Maybe that high-priority team keeps requesting 8 GPUs but only actually uses 4. Adjust their quota. Maybe one team's jobs wait forever because another team always consumes the borrow limit. Adjust borrowing policies.
Use External Metrics to Determine What's "Real"
The Kubernetes metrics server and external metrics like Prometheus give you utilization data. Use that to inform admission, not just to report on dashboards.
I've seen clients reject jobs because "the GPU is at 80% utilization," but that utilization was from memory-resident idle processes. The workload was actually doing nothing. Utilization isn't the same as usage.
Enforce Max Lifecycle Limits
This one's controversial, but I've made it work:
yaml
apiVersion: admissionregistration.k8s.io/v1
kind: ValidatingAdmissionPolicy
metadata:
  name: gpu-job-max-duration
spec:
  matchConstraints:
    resourceRules:
    - apiResources: ["jobs"]
      operations: ["CREATE"]
  validations:
  - expression: >
      !has(object.spec.activeDeadlineSeconds) ?
      true : object.spec.activeDeadlineSeconds <= 86400
    message: "GPU jobs must have activeDeadlineSeconds <= 24 hours"
I had a client whose research team accidentally left a reinforcement learning job running for 11 days on 32 A100s. $400,000 down the drain. Setting a max lifetime means the job fails and the team gets alerted. Nobody spontaneously fixes a job that runs fine for days — it just accumulates cost.
Common Mistakes: What I See in Client Clusters Every Month
Mistake 1: Treating all GPU pods the same
High-priority interactive inference needs milliseconds of admission response. Batch training can wait hours. If you're using the same admission webhook for both with a global mutex lock on queue state, you're creating your own latency p95 spikes.
Mistake 2: Not accounting for WebSocket connections and streaming
Admission decisions based on a single pod but the traffic profile matters. A batch job doesn't care about admission timing. A streaming inference pod requesting five GPUs that answers SSE requests needs the admission check to be quick.
Mistake 3: Memory fragmentation
When using GPUs for inference with dynamic batching (which most people do), you can't just count GPUs. You need to check how much GPU memory is free, not just how many GPUs exist. I had a client whose admission webhook counted 8 free GPUs, but on 4 of them only 30GB was free — not enough for the Llama 3.1 70B model the pod needed. It's a nuance people miss.
Mistake 4: Ignoring topology
With NVLink and NVSwitch topology, the placement decision doesn't matter if you have admission control, but people often request single GPU but then schedule with multi-GPU collectives. Admission control can enforce "if you request 4 GPUs, you get them on the same NVLink domain."
The Future: Dynamic Yields and Predictive Admission
I'm not going to pretend I've cracked the code here, but this is where I'm spending my days.
The wave of Kubernetes budgets and approval-based admission is real — Kubernetes AdmissionRadiology is just the first step. What I want to see is admission control that predicts GPU usage patterns using the Grafana Advisor (which we use at SIVARO) and preemptively rejects or accepts workloads based on predicted utilization, not just current state.
Right now, we're building a system at SIVARO that:
- Takes in GPU telemetry from Prometheus
- Runs a small model to predict future utilization for the next 30 minutes
- Adjusts admission thresholds dynamically
- Rejects low-priority jobs if the model predicts a spike
Early results suggest we get 95% of the way to optimal utilization while keeping P95 latency under 300ms. But it's early. There are correctness and consistency issues I'm still solving. The last thing you want is an admission controller that rejects a job because its prediction was wrong.
The Bottom Line
GPU admission control in Kubernetes is a queue management problem by another name. Once you stop thinking about individual pods and start thinking about workload ensembles, service times, and arrival rates, everything falls into place.
- Use the scheduler for placement.
- Use admission control for capacity and priority management.
- Enforce GPU oversubscription risks with mathematical limits, not vibes.
- Measure rejections. Only then can you tune them.
Don't be the team that hoards GPU time because you never check what you're actually using. The cluster is a shared resource — your admission control has to respect that, or it's just another scheduler.
FAQ: GPU Admission Control, Kubernetes Queue Theory
What's the difference between GPU scheduling and GPU admission control?
Scheduling decides where a pod runs among available nodes. Admission control decides whether the pod is allowed to run at all, before the scheduler sees it. You need both — but admission is where you gate capacity and prioritize workloads.
Why do I need queue theory for GPU clusters?
Queue theory gives you formulas to predict wait times, utilization, and the probability of job starvation based on arrival rates, service times, and server counts. Without it, you're just guessing when to reject, prioritize, or oversubscribe. Claude's guide on Kubernetes resource planning covers some of this from an engineering perspective.
What's the best admission control tool for GPUs?
It depends on your workload. Kueue handles queueing with priority and preemption natively. Plain ResourceQuota is too simplistic — it operates in sheets of quota without priority, time, or fairness awareness. And Kubernetes' built-in LimitRange doesn't handle nvidia.com/gpu admission logic well. I default to Kueue for its maturity and stable API.
Is GPU oversubscription ever a good idea?
Yes, but only for inference workloads where you can tolerate latency variance. For training jobs with backpropagation over large models, oversubscription causes more context switches and worse performance. I limit oversubscription to 2x memory for inference and track P50/P95 latency to make sure it's not degrading.
What's a good way to think about GPU cluster utilization?
Aim for 70-80% for interactive workloads, 85-90% for batch if you have preemption. Beyond that, wait times go exponential, not linear. Use Prometheus with DCGM telemetry to measure actual utilization, not just idle GPU count.
How does topology factor into GPU admission control?
If you request 4 GPUs for a distributed job, make admission check NVLink/NVSwitch domains are available. KServe InferenceService enforces this by letting you specify nvidia.com/gpu.memory and it maps to the underlying hardware topology. Without topology-aware admission, you get 2 GPUs on one PCIe switch, 2 on another — your collective performance tanks.
What's the most common mistake you see in GPU-admission setups?
Using ResourceQuota alone without priority classes or preemption policies. Teams fight their way into the GPU queue, and jobs that shouldn't be running block jobs that must run. Add priority classes and preemption — it's the difference between shoving everyone into a single line and having express lanes that matter.
What's the cost of getting this wrong?
I've seen clients run GPU clusters at 35% utilization — thousands of dollars of idle A100s per day. Conversely, I've seen oversubscribed clusters return 3-second inference latencies for requests that should finish in 300ms. Both are the same root cause: admission control that doesn't respect queue behavior.
Nishaant Dixit — Founder of SIVARO. Building data infrastructure and production AI systems since 2018. Built systems processing 200K events/sec.