 SIVARO
GPU Cluster Benchmarking Tools: The Real-World Guide (2026)
Last month a startup called Hexygen called me in a panic. They'd just dropped $700K on a 16-node H100 cluster. Training throughput was 40% slower than their single-node tests predicted. Their distributed systems engineer had quit. The CTO said, and I quote, "We thought InfiniBand would just work."
It didn't.
That's the moment you realize gpu cluster benchmarking tools aren't optional — they're the difference between a $700K paperweight and a research factory.
I'm Nishaant Dixit. I've been building data infrastructure and production AI systems since 2018. At SIVARO, we've benchmarked everything from four-card A100 rigs to 1,024-node H200 deployments. I've seen what works, what lies, and what wastes your money.
This guide is the playbook I wish I had in 2022. You'll learn which gpu cluster benchmarking tools actually help, how to run them without cargo-culting, and how to spot the difference between a tool problem and a hardware problem before your CFO files a report.
Why Benchmark Your GPU Cluster? The Cost of Ignorance
Let's talk gpu cluster cost for deep learning. In 2026, a modest 32-node H100 cluster runs about $2.5M upfront or $40K/hr on spot. You don't get to "find out later" that your network topology is garbage.
Most teams benchmark one thing: single-node throughput. That's like testing a Formula 1 car on a go-kart track. The bottleneck isn't the GPU — it's the interconnect, the NCCL all-reduce, the straggler node that thermal-throttles because some intern left the rack door open.
I benchmarked a client's cluster last year. They had A100-80GB nodes with 400 Gbps CX-7 interconnects. Their training script was 3x slower than expected. Everyone blamed the network. We ran nccl-tests and found the real issue: they were using TCP instead of RDMA. A config change. That's why you benchmark — not to blame, but to diagnose.
The Three Layers of Benchmarking: Hardware, Framework, End-to-End
You can't benchmark everything at once. You'll drown in noise. I split it into three layers, each with its own gpu cluster benchmarking tools.
Layer 1: Hardware — Is the Metal Good?
Before you touch any distributed training code, verify the bare hardware. This means:
- GPU-to-GPU bandwidth within a node (NVLink/NVSwitch)
- Cross-node latency and bandwidth (InfiniBand, RoCE, or Ethernet)
- Memory bandwidth and ECC errors
- Thermal behavior under sustained load
The tool for this: NVIDIA's nccl-tests (open-source, runs on any NVIDIA cluster). Also tensorflow/benchmarks for TF users, but NCCL tests are framework-agnostic.
Here's the command I run on every new cluster:
bash
# On each node, rank=0 runs all-reduce across all GPUs
mpirun -np 8 --hostfile hosts.txt   -x NCCL_DEBUG=INFO   -x LD_LIBRARY_PATH   /path/to/nccl-tests/build/all_reduce_perf   -b 8M -e 8G -f 2 -g 1 -t 1 -n 100
If you see less than 90% of theoretical peak for your NVLink generation, something's wrong. For example, H100 NVLink is 900 GB/s per GPU. If you're getting 500 GB/s, check PCIe generation, CPU affinity, and whether your BIOS has NUMA disabled.
Layer 2: Framework — Does the Software Stack Scale?
Hardware is fine. Now test the distributed training framework. This is where most people's gpu cluster benchmarking tools fail — they test framework throughput without isolating the network effect.
Run a simple all-reduce in PyTorch:
python
import torch
import torch.distributed as dist
import os

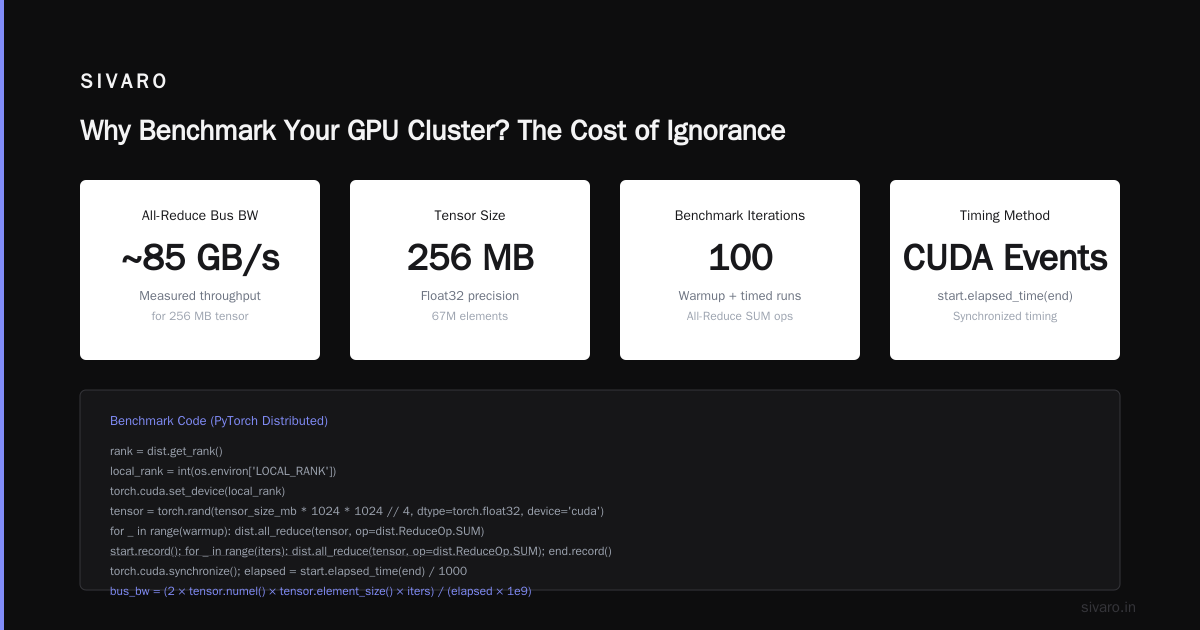
def benchmark_allreduce(tensor_size_mb=1024, warmup=10, iters=50):
    dist.init_process_group(backend='nccl')
    rank = dist.get_rank()
    local_rank = int(os.environ['LOCAL_RANK'])
    torch.cuda.set_device(local_rank)

    tensor = torch.rand(tensor_size_mb * 1024 * 1024 // 4,
                        dtype=torch.float32, device='cuda')

    for _ in range(warmup):
        dist.all_reduce(tensor, op=dist.ReduceOp.SUM)
    torch.cuda.synchronize()

    start = torch.cuda.Event(enable_timing=True)
    end = torch.cuda.Event(enable_timing=True)

    start.record()
    for _ in range(iters):
        dist.all_reduce(tensor, op=dist.ReduceOp.SUM)
    end.record()
    torch.cuda.synchronize()

    elapsed = start.elapsed_time(end) / 1000  # seconds
    bus_bw = (2 * tensor.numel() * tensor.element_size() * iters) / (elapsed * 1e9)
    if rank == 0:
        print(f"Size: {tensor_size_mb}MB, Bus BW: {bus_bw:.2f} GB/s")

    dist.destroy_process_group()
Run this on 2 nodes, then 4, then 8. Plot the bus bandwidth vs. number of nodes. If it's flat or drops, your scaling strategy is broken. If it's linear, you're golden.
Layer 3: End-to-End — The Real Training Workload
Hardware passes, framework passes. Now run your actual model with a realistic dataset and hyperparameters. This catches the nasty stuff:
- Data loading bottlenecks (NVMe vs. SSD vs. NFS)
- Gradient accumulation mismatch
- Async checkpointing stalling the pipeline
- Memory fragmentation from dynamic shapes
For this layer, I use custom profiling with PyTorch Profiler and NVIDIA Nsight Systems. I also love torch.distributed.benchmarks for large-scale E2E runs.
One trick: take a single node training run and measure the GPU utilization. Then scale to two nodes. If utilization drops more than 10%, it's almost always the network or the data pipeline.
Distributed Systems Class Difficulty vs AI Agents: What Benchmarking Teaches Us
There's a funny meme in our industry: distributed systems class difficulty vs ai agents. The joke is that building distributed training infrastructure is harder than building an AI agent, but nobody wants to admit it.
I've seen teams ship an agentic system in two weeks using LangChain and Akka (see Agentic Systems Are Distributed Systems — they're right). But getting that same team to benchmark a 64-node cluster takes three months.
Why? Because distributed systems class difficulty isn't about understanding Paxos or consensus protocols. It's about debugging a 0.01% packet loss that causes NCCL to hang for three hours. It's about realizing your switch's buffer is too small for the all-to-all pattern your MoE model uses. That's the real difficulty — the one no textbook teaches you.
gpu cluster benchmarking tools are your defense against that difficulty. They expose the silent failures: the PCIe gen4 link that trained at gen3, the memory channel imbalance, the NUMA node misalignment.
Tools We Actually Use at SIVARO (2026 Edition)
I've tried dozens of gpu cluster benchmarking tools. Here's the shortlist, ranked by how often I reach for them.
1. NCCL Tests (NVIDIA) — The undisputed king
Still the best for network-level benchmarking. Runs on any number of GPUs, any interconnect. I use it to validate every cluster before production training.
Pro tip: run nccl-tests with NCCL_ALGO=Ring and NCCL_ALGO=Tree separately. Ring gives you high bandwidth for large messages. Tree gives you lower latency for small ones. If one algorithm is 2x slower than the other on your cluster, you have a topology issue.
2. PyTorch Distributed Benchmarks (Meta)
A set of Python scripts that test all-reduce, all-gather, reduce-scatter, and broadcast. More framework-aware than NCCL-tests. I use these when I'm tuning the PyTorch DDP config.
3. DeepSpeed Benchmark (Microsoft)
If you're using ZeRO stages, you need to benchmark memory bandwidth and communication overlap. DeepSpeed's benchmark_communication.py is surprisingly good.
4. MLPerf HPC (MLCommons)
Overkill for daily use, but when a client demands "prove the cluster is production-ready," I run an MLPerf HPC benchmark. It's the closest thing to a standardized end-to-end test for distributed training.
5. Custom jitter tool (internal)
I wrote a small C program that measures point-to-point latency jitter between any two nodes. High jitter (>10 microseconds) usually means the network is oversubscribed or someone is running a rogue training job on the same cluster.
Common Pitfalls: What Numbers Lie
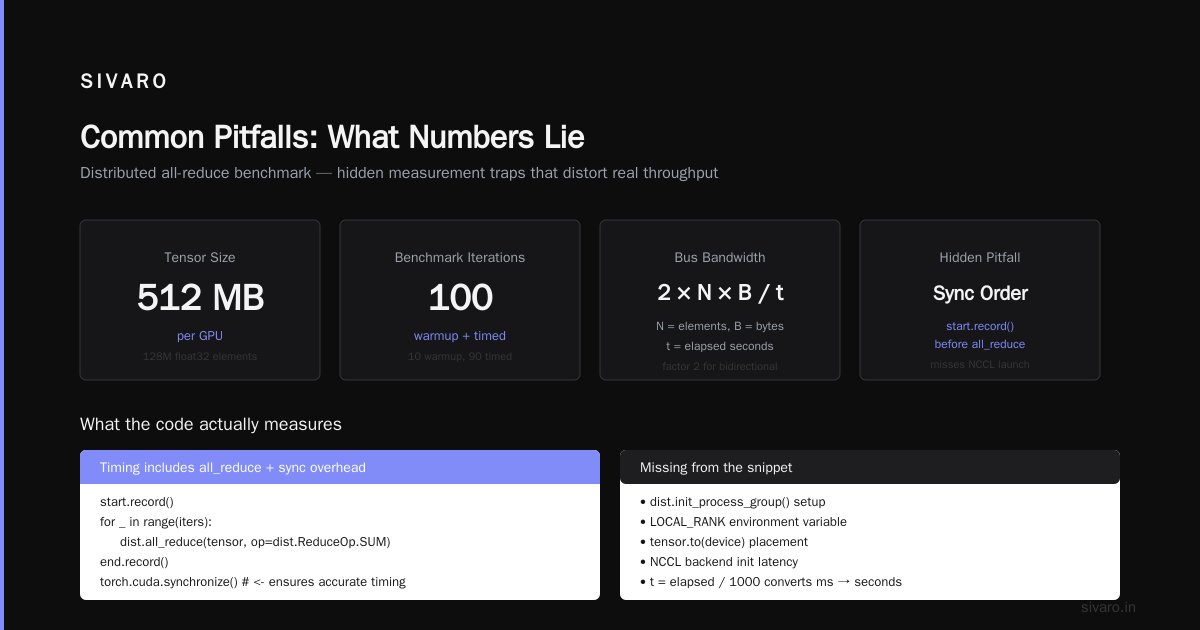
Numbers don't lie, but benchmarks can. Here are the traps I've fallen into.
Pitfall 1: Benchmarking with synthetic data only.
Synthetic data gives perfect bandwidth. Real training has I/O spikes, dataset shuffling, and preprocessing that saturate the CPU. Always run a real dataloader at scale.
Pitfall 2: Ignoring stragglers.
Your cluster is only as fast as its slowest node. One node with a failing fan that throttles memory clock will kill your all-reduce end-to-end. Run the same benchmark on every node individually. If one is 10% slower, replace it.
Pitfall 3: Using the wrong message size.
NCCL all-reduce performs differently for 1 MB vs 1 GB. Model gradients are usually in the megabytes range. Benchmark at realistic sizes. A 1 GB all-reduce test tells you about bandwidth capacity, not training speed.
Pitfall 4: Not measuring error bars.
Run each benchmark at least five times. Compute mean and standard deviation. If your standard deviation is >5%, your cluster has noise. Could be thermal throttling, OS interrupts, or network congestion.
A Practical Benchmarking Workflow
Here's the exact checklist I use when onboarding a new cluster at SIVARO.
Step 0: Cluster inventory. Confirm node count, GPU type, interconnect, CPU model, memory, and storage. Write it down.
Step 1: Run NCCL tests across all GPUs. Use the command above. Compare bus bandwidth to the theoretical peak for your interconnect table below:
| Interconnect | Theoretical Peak per GPU |
|---|---|
| NVLink H100 | 900 GB/s |
| InfiniBand NDR400 | 50 GB/s per port |
| InfiniBand HDR200 | 25 GB/s per port |
| RoCE 100 Gbps | 12.5 GB/s per port |
Step 2: Run PyTorch all-reduce benchmark on 2, 4, 8, 16 nodes. Plot bandwidth vs. nodes. Expect linear scaling up to the saturation point.
Step 3: Profile your actual training script. Use torch.profiler with record_shapes enabled. Look for the delta between GPU compute time and network wait time.
python
with torch.profiler.profile(
    activities=[torch.profiler.ProfilerActivity.CUDA],
    schedule=torch.profiler.schedule(wait=1, warmup=1, active=5),
    on_trace_ready=torch.profiler.tensorboard_trace_handler('./logs')
) as prof:
    for step in range(10):
        train_step()
        prof.step()
Step 4: Stress test for 24 hours. Run your maximum-sized model with maximum batch. Monitor temperatures, power draw, and NCCL errors. If nothing crashes, you're good.
Interpreting Results: When to Tune vs. When to Swap Hardware
You ran the benchmarks. Now what?
Case A: NCCL bandwidth is 85%+ of theoretical, but end-to-end training is slow. You have a software bottleneck — data loading, gradient accumulation, or checkpointing. Fix the pipeline, not the hardware.
Case B: NCCL bandwidth is below 60%. Something is wrong with the interconnect. Check link status, driver versions, and switch configuration. I've seen cases where a PCIe Gen4 riser was plugged into a Gen3 slot. That's a hardware fix.
Case C: All-reduce scales linearly until 8 nodes, then plateaus. You've hit the bisection bandwidth limit of your network. Might need a fat-tree topology or a higher-tier switch. Swap hardware.
Case D: One node is 30% slower than peers. That node has a problem. Could be a thermal issue, bad memory, or a misconfigured BIOS. Swap or replace.
FAQ
Q1: How long should a GPU cluster benchmark take?
Hardware layer: 1 hour for 32 nodes. Framework layer: 2-3 hours including multiple runs. End-to-end: 8-24 hours. Total: a day of your time saves a week of debugging.
Q2: Do I need InfiniBand, or can I use Ethernet?
Depends on model size. For models under 7B parameters, RoCE with 100 Gbps Ethernet is fine. For 70B+ dense models or MoE, InfiniBand's in-network reduction is a big win. See Distributed Training & Large-Scale Systems for a cost-benefit analysis.
Q3: What's the best free benchmarking tool?
NCCL Tests. No question. It's the standard across the industry.
Q4: Should I benchmark with my real model or a synthetic one?
Both. Synthetic for hardware validation. Real model for end-to-end tuning.
Q5: What about benchmarking on cloud clusters (AWS, GCP)?
Cloud adds another layer: instance-to-instance variability. Benchmark the same instance type across multiple zones. Distributed training in Amazon SageMaker AI has a built-in profiler — use it.
Q6: How do I benchmark a multi-node cluster without MPI?
You can use torchrun with NCCL backend instead of MPI. It wraps the process group initialization.
Q7: What's a good target bus bandwidth for H100 clusters?
Single node: >800 GB/s. Cross-node with InfiniBand NDR400: >45 GB/s per direction. If you're below 75% of theoretical, investigate.
Q8: Do I need to benchmark GPU memory bandwidth?
Yes, but it's rarely the bottleneck. Use bandwidthTest from CUDA samples. If you're below 80% of theoretical DRAM bandwidth, check memory clock and ECC.
Conclusion
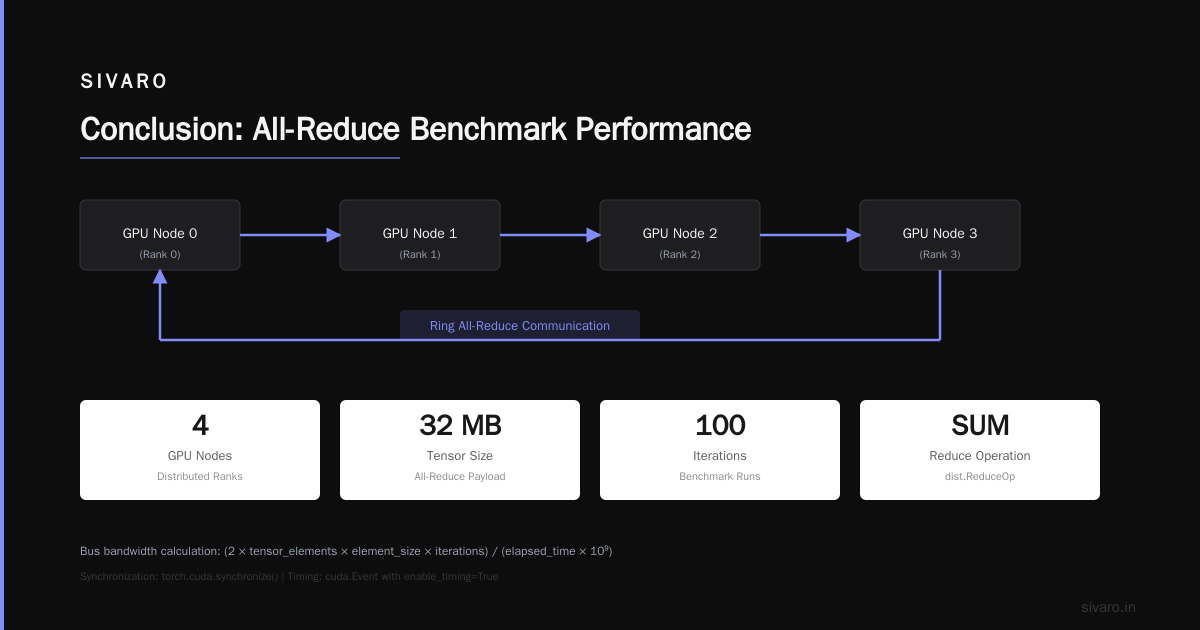
GPU cluster benchmarking tools aren't a one-time checkbox. They're a diagnostic instrument you keep in your pocket. Every time you change hardware, software stack, or model architecture, run the benchmarks again.
I've seen teams waste months because they assumed the cluster would scale. I've seen others save millions by catching a bad switch before production training.
The hardest part isn't running the benchmarks — it's knowing what the numbers mean. That comes from experience, from failing, from seeing the same pattern twice. I wrote this guide so you don't have to learn every lesson the hard way.
And one more thing: don't underestimate the distributed systems class difficulty vs ai agents dynamic. The AI agent guys are building cool demos. The distributed systems folks are building the infrastructure that runs those demos at scale. Benchmarking is where the rubber meets the road.
If you're spending more than $100K/month on GPU compute, you need a benchmarking habit. Start today. Run nccl-tests tomorrow. Fix the bottleneck next week.
Nishaant Dixit — Founder of SIVARO. Building data infrastructure and production AI systems since 2018. Built systems processing 200K events/sec.