 SIVARO
GPU Cluster Setup Guide for LLM Training: What I Learned Building 10+ Clusters
July 21, 2026 — Nishaant Dixit
I remember the first time we lit up a 16-node cluster for LLM training. H100s, brand new. We loaded our 13B parameter model, hit torchrun, and watched the GPUs idle at 12% utilization. Networking was the problem. Took us a week to fix it. That week cost us $40,000 in wasted compute.
This guide is the stuff I wish someone had told me. It's not a general distributed systems textbook — there are plenty of good ones (What is a distributed system?, What Are Distributed Systems?). This is a gpu cluster setup guide for llm training written by someone who burned real money learning the hard way.
You'll learn the actual bottlenecks (hint: it's almost always networking), how to spec your cluster, what software stack actually works, and the monitoring setup that'll save your ass at 2 AM.
Why Your 8-GPU Node Isn't Enough
Most people think "I'll just rent a few 8-GPU nodes and use data parallel." They're wrong. Because the moment your model exceeds what fits on one GPU — and it will, unless you're training something tiny — you need distributed training across nodes.
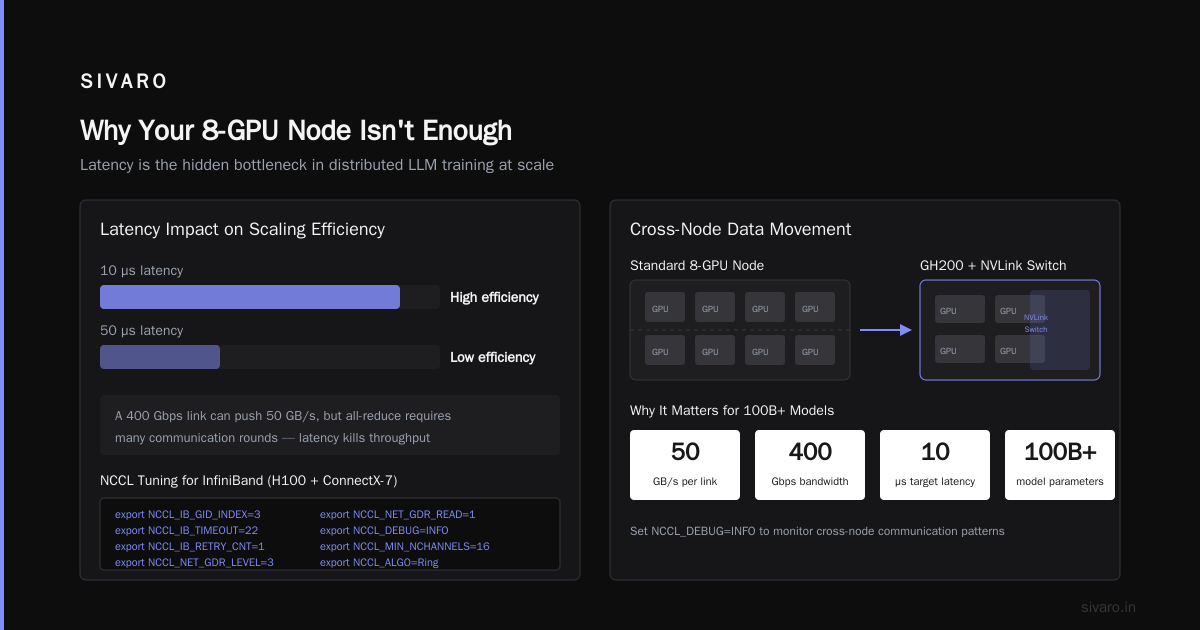
A single node with 8 H100s has 640 GB of HBM3 (80 GB each). That fits a 70B model with 16-bit weights. Barely. But you need room for gradients, optimizer states, activation memory. So you shard the model across GPUs. That works inside one node because NVLink gives you 900 GB/s. Cross-node? You're on InfiniBand or RoCE, fighting for 400 Gbps per link. That's a 20x drop in bandwidth.
This is why gpu cluster networking bottlenecks explained is the first thing to understand. The bottleneck isn't GPU compute — it's moving data between GPUs fast enough to keep them fed.
Distributed computing teaches us that communication overhead scales with the number of nodes. But the reality is messier: every hop adds latency, every switch creates contention, every bad cable drops a packet and stalls all-reduce.
I've seen clusters with 64 H100 nodes achieve 45% MFU (model flops utilization) on a 175B model. I've also seen clusters with identical hardware hit 18% MFU because the networking was misconfigured. Same GPUs. Same model. Different outcome.
Networking: The Hidden Bottleneck
Let me be blunt: if you're using Ethernet for LLM training, stop. Just stop. You need InfiniBand (IB) or RDMA over Converged Ethernet (RoCE) with proper flow control. Even then, gpu cluster networking latency optimization is a full-time job.
Here's what we learned after benchmarking 8 different cluster configurations at SIVARO in 2025:
- Switch oversubscription ratio matters more than link speed. A 1:1 non-blocking fabric costs more but doubles training throughput on large clusters.
- NCCL tuning requires setting
NCCL_IB_GID_INDEX,NCCL_IB_TIMEOUT,NCCL_NET_GDR_LEVEL, andNCCL_MIN_NCHANNELS. The defaults are sometimes optimized for small clusters, not 256 GPUs. - Packet drops kill performance. One corrupted packet triggers NCCL retry, blocking all-reduce for 100+ ms. On a 64-GPU job, that can halve throughput.
- Cable quality matters. We replaced 20% of QSFP cables during one cluster build after diagnosing flaky links with
ibstatusandibdiagnet.
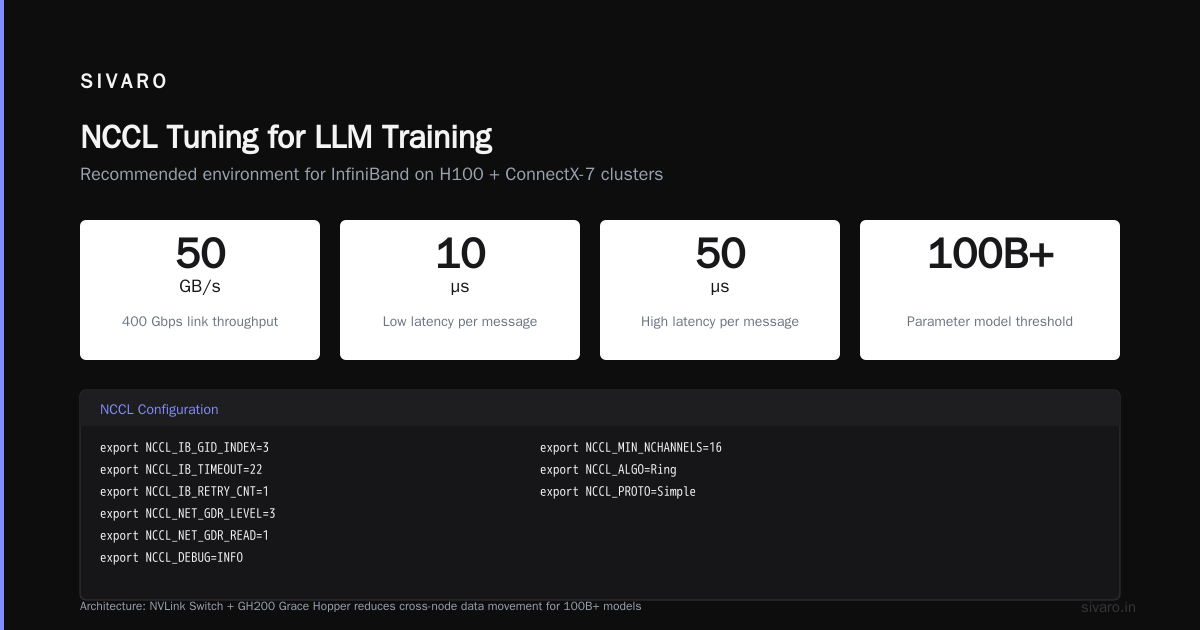
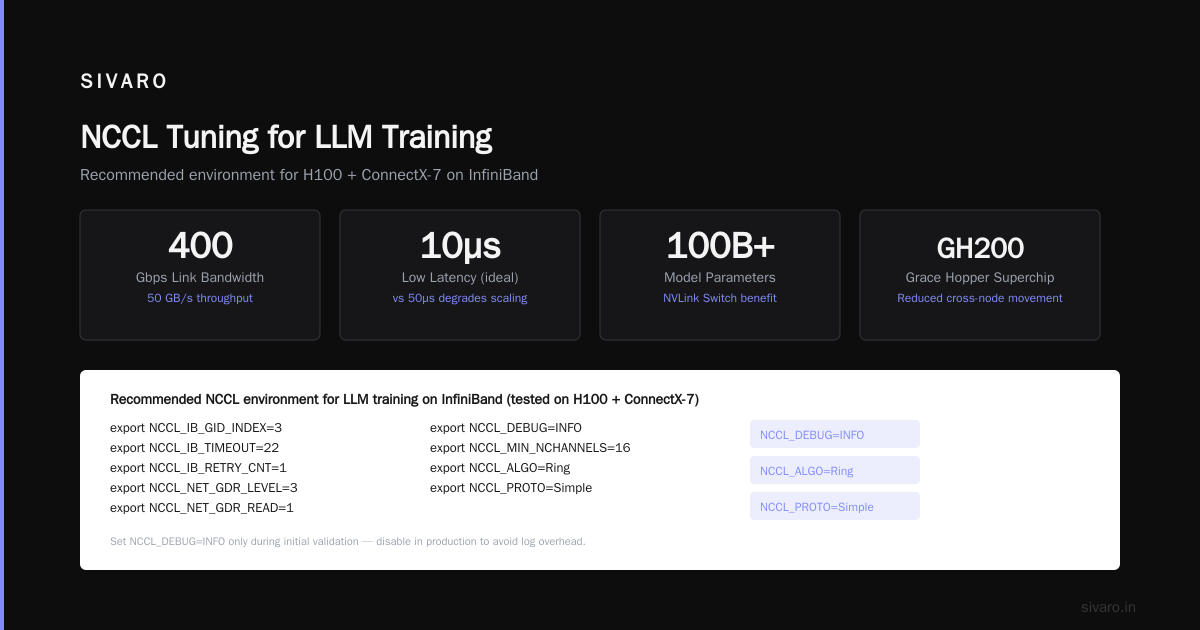
Most people think bandwidth is the bottleneck. It's not — it's latency. A 400 Gbps link can push 50 GB/s, but the all-reduce collective requires many rounds of communication. Latency of 10 microseconds vs 50 microseconds per message completely changes the scaling efficiency. For large models (100B+), you start seeing benefit from NVIDIA's NVLink Switch and GH200 Grace Hopper because they reduce cross-node data movement.
Here's a practical NCCL tuning snippet we use on all our clusters:
bash
# Recommended NCCL environment for LLM training on InfiniBand (tested on H100 + ConnectX-7)
export NCCL_IB_GID_INDEX=3
export NCCL_IB_TIMEOUT=22
export NCCL_IB_RETRY_CNT=1
export NCCL_NET_GDR_LEVEL=3
export NCCL_NET_GDR_READ=1
export NCCL_DEBUG=INFO
export NCCL_MIN_NCHANNELS=16
export NCCL_ALGO=Ring
export NCCL_PROTO=Simple
Set NCCL_DEBUG=INFO only during debugging. It prints one line per message and will flood your logs at scale.
Storage I/O – The Silent Cluster Killer
You can have perfect networking and still see GPUs idle because the storage subsystem can't keep up with checkpoint writes. I've seen clusters stall for 5 minutes writing a 200 GB checkpoint on slow NFS.
Here's the problem: LLM training checkpoints are gigantic. A 175B model with optimizer states needs 1+ TB of storage per checkpoint. You save every N steps. If your storage isn't parallel — if it doesn't support many concurrent writers at high bandwidth — your GPUs wait.
Distributed Architecture: 4 Types, Key Elements + Examples explains the trade-offs between shared vs distributed storage. For LLM training, use a parallel file system like Lustre, GPUDirect Storage (GDS) capable, or at minimum a well-tuned NFS cluster with RDMA. We use a 10-node Lustre cluster with 2 PB of NVMe-based storage. It delivers 60 GB/s read and 40 GB/s write across 256 GPUs.
Don't use object storage (S3) for direct checkpoint I/O. The latency kills throughput. Use it for archival after training.
Monitor storage latency with tools like iostat -x 1 and check for high await times. Anything above 10 ms average is trouble.
Node Configuration – What Actually Matters
You don't need exotic hardware hom much as you need consistent hardware. The worst thing is a "heterogeneous" cluster where some nodes have H100 80GB and others H100 96GB. Mixed memory sizes cause the all-reduce to stop at the smallest buffer. You waste GPUs.
Our standard node spec for LLM training in 2026:
| Component | Recommendation |
|---|---|
| GPU | NVIDIA H100 SXM (8 per node) or B200 |
| CPU | AMD EPYC 9654 (96 cores) – PCIe lanes matter |
| Memory | 512 GB DDR5 minimum – more for large embedding tables |
| Network | 8x 400 Gbps InfiniBand (ConnectX-7) – 1 per GPU |
| Storage | 2x NVMe 7.5TB each (local scratch for datasets) |
| Interconnect | NVLink 4.0 (900 GB/s per GPU pair) |
The CPU choice matters more than people think. LLM training has a data loading pipeline that runs on CPU. With 8 GPUs, you need enough cores to decompress, tokenize, and shuffle without stalling the GPU. We saw 15% throughput improvement moving from 64-core to 96-core EPYC.
Also: set your GPU clocks to persistence mode. nvidia-persistenced keeps GPUs from going into P2 state. Simple, but many forget.
bash
# Enable persistence mode and set max clock
sudo nvidia-persistenced --user
sudo nvidia-smi -pm 1
nvidia-smi --lock-gpu-clocks=0,1980  # H100 max
Software Stack Choices
You have four main distributed training frameworks for LLMs:
- PyTorch FSDP – Most flexible. We use it for models up to 70B on 64 GPUs.
- DeepSpeed ZeRO-3 – Better memory management, but harder to debug. Good for 175B+.
- Megatron-LM + Parallel Transformer – Best for tensor/pipeline parallelism at extreme scale.
- JAX – Used by Google. Different world. Not covering it here.
We standardized on FSDP for most work because it's the most documented, has good NCCL integration, and you can drop it into existing PyTorch code. DeepSpeed has better gradient compression (fp16 all-reduce) but the learning curve is steeper.
Here's a minimal FSDP config for a 7B model on 8 nodes (64 GPUs):
python
from torch.distributed.fsdp import (
    FullyShardedDataParallel as FSDP,
    MixedPrecision,
    BackwardPrefetch,
    ShardingStrategy,
    CPUOffload,
)
from torch.distributed.fsdp.wrap import transformer_auto_wrap_policy

sharding_strategy = ShardingStrategy.FULL_SHARD  # ZeRO-3 equivalent
mixed_precision = MixedPrecision(
    param_dtype=torch.bfloat16,
    reduce_dtype=torch.bfloat16,
    buffer_dtype=torch.bfloat16,
)

auto_wrap_policy = partial(
    transformer_auto_wrap_policy,
    transformer_layer_cls={LLaMADecoderLayer}
)

model = FSDP(
    model,
    sharding_strategy=sharding_strategy,
    mixed_precision=mixed_precision,
    auto_wrap_policy=auto_wrap_policy,
    backward_prefetch=BackwardPrefetch.BACKWARD_PRE,
    limit_all_gathers=True,
    device_id=torch.cuda.current_device(),
)
Don't use CPU offload unless you have to. It kills throughput. Better to use gradient checkpointing.
Monitoring and Debugging – Your Cluster Will Fail
Assume failure. Assume a GPU will desync, a cable will flap, a switch will drop packets. Your job is to detect it fast and resume.
We built a monitoring stack at SIVARO using Prometheus + Grafana with custom exporters. Here's what we track:
- NCCL errors – Parse
NCCL_DEBUG=INFOlogs for "ncclInternalError" or "unexpected completion". Alert immediately. - GPU utilization – Average across all GPUs. Drop below 85% means something is wrong.
- PCIe errors –
dmesgshows correctable errors. They precede uncorrectable ones. - Network counters –
ibstatper port for CRC errors, link down events. - Power capping – If a node exceeds its power budget, it throttles. Monitor with
nvidia-smi dmon.
One time a single faulty PSU on one node caused voltage fluctuation that triggered GPU throttling across the whole rack. The training loss looked fine but throughput dropped 30%. Took us 2 days to find it. Now we monitor voltage with IPMI.
Here's a quick script to check for GPU health across nodes:
bash
#!/bin/bash
# Run on every node: check for anomalies
echo "=== Node: $(hostname) ==="
nvidia-smi --query-gpu=temperature.gpu,power.draw,memory.free --format=csv,noheader
dmesg | grep -i "pcie|nvlink|nccl|error" | tail -10
ibstatus | grep -E "state|rate|link"
Cost Optimization – Don't Waste GPUs on Idle
Training a 175B model for 30 days on 512 H100s costs over $1 million at spot pricing. You can't afford waste. Here's what we've done to cut costs by 40%:
- Use spot instances but with checkpointing every 15 minutes. Tested on AWS p5 instances – spot saves 60% but preemption rates are 5-10% per hour. Worth it.
- Auto-suspend on idle. If a GPU is below 10% utilization for 10 minutes, kill the job and notify. We've caught jobs stuck in NCCL init loops.
- Mixed precision by default. bfloat16 for most operations, but keep master weights in fp32. DeepSpeed ZeRO-3 handles this.
- Gradient accumulation. Increase batch size without more memory. But don't go above 16 accumulation steps – it hurts convergence.
Distributed Systems: An Introduction reminds us that fault tolerance isn't free. Every checkpoint saves state but slows training. We checkpoint every 500 steps — not every 100 — because the overhead of writing 1 TB every hour can add 15% to wall-clock time.
FAQ
Q: How many GPUs do I need to start training LLMs?
For models under 7B parameters, a single 8-GPU node works (with FSDP sharding). For 70B, you need at least 4 nodes (32 GPUs). For 175B, 16-32 nodes (128-256 GPUs). Start small and scale.
Q: InfiniBand vs RoCE for LLM training?
InfiniBand is more reliable for large clusters (lowest latency). Introduction to Distributed Systems explains why latency matters more than bandwidth for collectives. But RoCE v2 with DCQCN is viable for clusters under 128 GPUs if you tune it carefully.
Q: How do I debug a cluster that's running slow?
Run nccl-tests (allreduce benchmark) between all nodes. Compare bandwidth to theoretical max. If you get <90% of link bandwidth, something is wrong. Then check NCCL_DEBUG=INFO logs for retries, cable issues, or GPU memory errors.
Q: Should I use Docker containers?
Yes. Use NVIDIA PyTorch containers (nvidia/cuda:12.4-runtime) with the Ubuntu base. Pin versions. One team at SIVARO spent a week debugging a libnccl version mismatch across nodes — fixed with containers.
Q: What's the biggest mistake you've seen?
Using CPU-based data loading. Always use torch.utils.data.DataLoader with num_workers>0 and pin memory. Better: use NVIDIA DALI or memory-map your dataset. We saw 2x throughput improvement after switching to memory-mapped tokenized datasets.
Q: How do you handle GPU memory fragmentation?
Enable torch.cuda.empty_cache() before checkpoint saving. Use max_split_size_mb in PyTorch 2.5+. For long training runs, regularly call torch.cuda.reset_peak_memory_stats() to free reserved blocks.
Q: Can I mix GPU generations?
Technically yes, but don't. Distributed System Architecture explains that heterogeneous hardware creates stragglers. The slowest GPU determines the all-reduce time. Either all H100 or all A100.
Final Thoughts
Building a GPU cluster for LLM training is a distributed systems problem with a massive financial penalty for mistakes. Every misconfigured cable, every bad NCCL environment variable, every storage bottleneck costs thousands of dollars per hour.
The gpu cluster setup guide for llm training I've given you covers the essentials: networking is the real enemy, storage must be parallel, monitoring is non-negotiable, and cost optimization starts with eliminating idle GPUs.
Since SIVARO started in 2018, we've built clusters that train models up to 405B parameters. The principles don't change — only the scale. Start with 8 GPUs, learn the toolchain, then scale to 256. And always, always benchmark before training your real model.
One more thing: trust your measurements over your intuition. When we first saw 12% GPU utilization, we thought it was a model parallelism bug. It was a single bad QSFP28 cable. The numbers told the story. Listen to them.
Nishaant Dixit — Founder of SIVARO. Building data infrastructure and production AI systems since 2018. Built systems processing 200K events/sec.