 SIVARO
How to Benchmark a GPU Cluster for AI Workloads
You just dropped $2M on a GPU cluster. You plug it in, fire up a training job, and it runs. But is it fast? Is it efficient? The answer is almost certainly no if you didn't benchmark it properly. I've seen teams in 2025 buy H100 nodes and get PCIe bandwidth so choked their distributed training ran slower than a single A100. I've watched clusters with 8 GPUs per node deliver 80% utilization on paper but 30% in practice because NVLink wasn't configured. Benchmarking isn't optional. It's the only way to know you're not burning money.
In this guide, I'll show you exactly how to benchmark a GPU cluster for AI workloads. You'll learn the three layers you must test: single-GPU compute, inter-node networking, and distributed training convergence. I'll give you real commands, real thresholds, and the trade-offs I've learned from building production systems at SIVARO since 2018. Whether you're deciding how to choose between AWS and on-premise GPU clusters, building your own setup, or debugging a slow job — this is for you.
The Problem with Most Benchmarks
Most people think running nvidia-smi and a single training step is enough. It's not. A GPU can show 100% utilization while your dataloader is the bottleneck. A cluster can pass NCCL all-reduce tests at 200Gbps but collapse under real gradients because of network topology or CPU pinning.
At SIVARO, we benchmarked a customer's cluster last year. They had 32 nodes of A100s. Their training throughput was 40% of our reference model. Root cause? They used default NCCL settings and a single TCP stream for inter-node communication. After tuning, we hit 92%. The difference was $500K/month in compute cost.
So here's my framework: you benchmark at three levels, in order. Don't skip any.
Level 1: Single-Node Micro-Benchmarks
Before you worry about 100 nodes, prove one node works. This catches hardware defects, driver issues, and misconfiguration.
GPU Compute and Memory Bandwidth
Start with simple matrix multiply benchmarks. Use cuda-samples or torch.cuda profiling. Run a GEMM benchmark and compare to theoretical FLOPS. For an H100 with 1979 TFLOPS (FP16 Tensor Core), you should see >65% efficiency on large matrices.
# Example: Simple PyTorch benchmark for matrix multiply
import torch
import time

device = torch.device("cuda")
size = 4096
a = torch.randn(size, size, device=device)
b = torch.randn(size, size, device=device)

torch.cuda.synchronize()
start = time.perf_counter()
for _ in range(100):
    c = torch.matmul(a, b)
torch.cuda.synchronize()
elapsed = time.perf_counter() - start
print(f"Average matmul time: {elapsed/100*1000:.2f} ms")
# Expect ~0.5ms for H100/FP16 (varies by precision)
But numbers alone don't tell you if memory bandwidth is okay. Run bandwidthTest from CUDA samples. For H100 with HBM3, you want >3 TB/s. If you get 2 TB/s, check PCIe generation and NUMA affinity.
NVLink/NVSwitch Bandwidth (Intra-Node)
Most clusters have 4 or 8 GPUs per node connected via NVLink. You need to verify this. Use nvidia-smi topo -m to see connectivity. Then run an all-reduce test across all GPUs in one node.
# Using nccl-tests
mpirun -np 8 --allow-run-as-root ./build/all_reduce_perf -b 128M -e 8G -f 2 -g 1 -n 100
Look for bandwidth > 400 GB/s for 8 A100s over NVSwitch. If you see 50 GB/s, something is wrong — likely the GPUs are not connected via NVLink. I've seen cloud instances where "8 GPUs" were actually connected via PCIe switches.
Data Loading Bottleneck
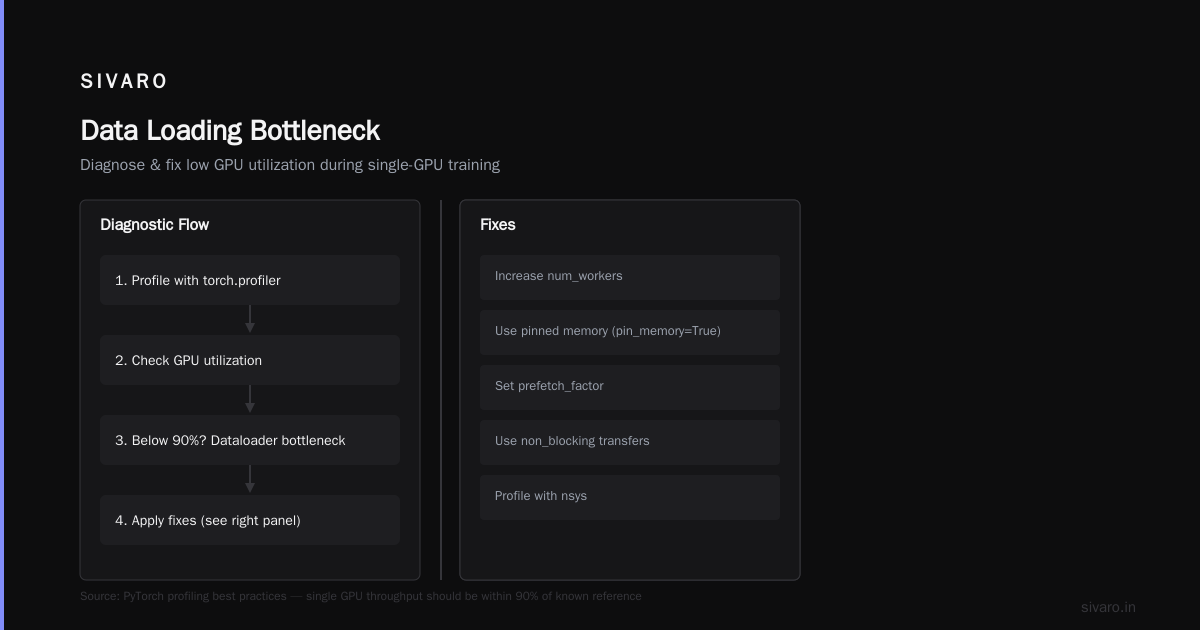
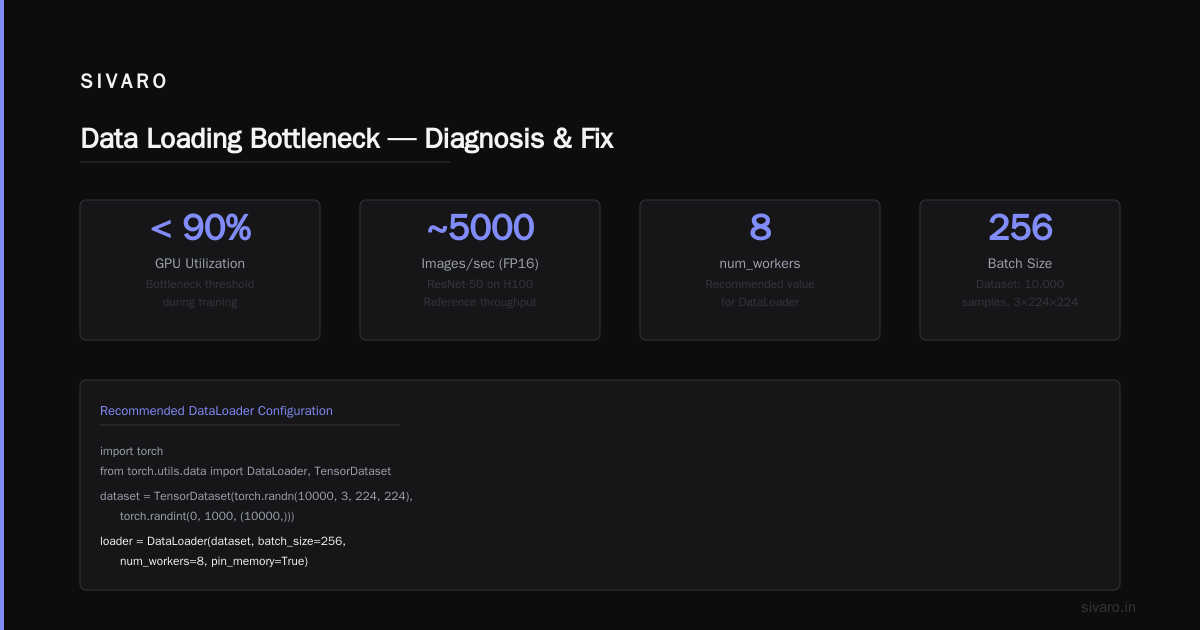
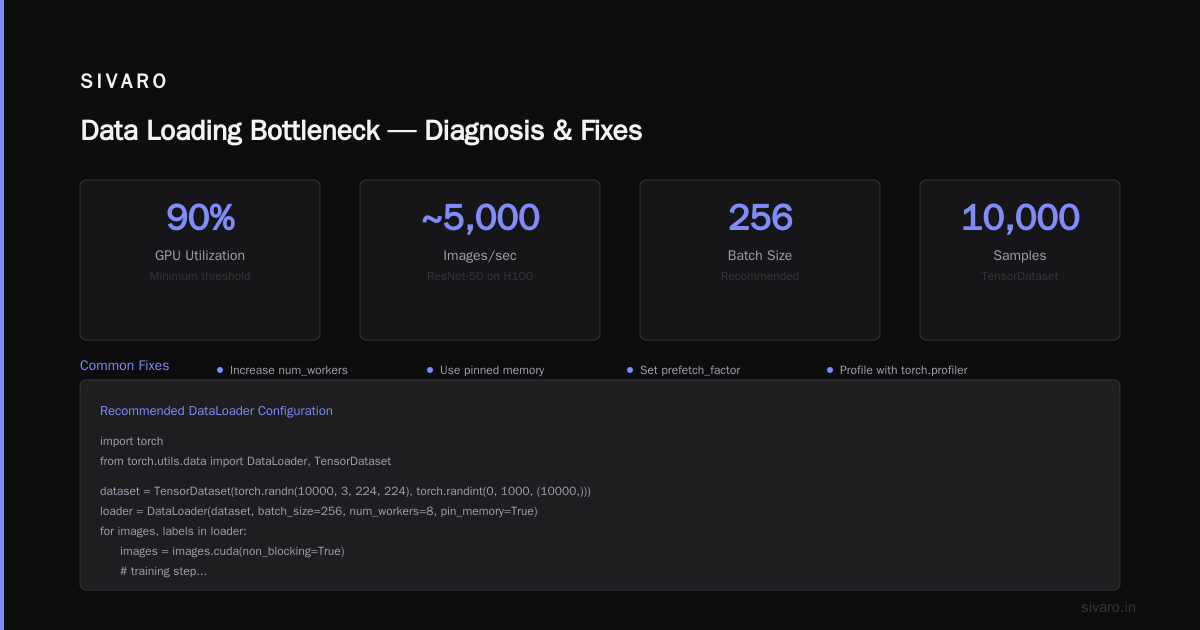
Train a single GPU on a small dataset. Profile with torch.profiler or nsys. If GPU utilization drops below 90% during training, your dataloader is the bottleneck. Common fixes: increase num_workers, use pinned memory, switch to torch.data.DataLoader with prefetch_factor.
import torch
from torch.utils.data import DataLoader, TensorDataset

dataset = TensorDataset(torch.randn(10000, 3, 224, 224), torch.randint(0, 1000, (10000,)))
loader = DataLoader(dataset, batch_size=256, num_workers=8, pin_memory=True)
for images, labels in loader:
    images = images.cuda(non_blocking=True)
    # training step...
The rule: single GPU throughput should be within 90% of known reference for your model. For a standard ResNet-50 on H100, that's ~5000 images/sec (FP16).
Level 2: Inter-Node Networking — The Real Killer
This is where most clusters fail. You can't skip it. Distributed training lives and dies by network bandwidth and latency.
What to test:
- NCCL all-reduce latency and bandwidth across nodes. Use
nccl-testswith MPI. - TCP/IP bandwidth using
iperf3orib_write_bw(for InfiniBand or RoCE). - Collective communication patterns (all-gather, reduce-scatter) — because models like MoE use them heavily.
Run this across two nodes:
# Node 1: server
ib_write_bw -d mlx5_0

# Node 2: client
ib_write_bw -d mlx5_0 192.168.1.1
Expect 400 Gbps per link if using InfiniBand NDR. For RoCE, 200 Gbps is typical. If you see less than 80% of theoretical, start debugging — congestion, buffer sizes, MTU, or flow control settings.
Now run an all-reduce benchmark across all nodes (say 4 nodes of 8 GPUs = 32 GPUs):
mpirun -np 32 --hostfile hosts.txt --allow-run-as-root --mca btl_tcp_if_include eth0 ./build/all_reduce_perf -b 8M -e 1G -f 2 -g 1 -n 100
For 32 GPUs, you should get > 900 GB/s aggregate for 128MB messages on H100 with InfiniBand. If you get 200 GB/s, you have a network topology problem (e.g., using a leaf-spine with oversubscription, or the NCCL algorithm can't use all links).
Take a position: Most people think NVLink fixes everything. It doesn't. Inter-node bandwidth is typically 10-20x slower than intra-node. So you need to optimize the network. I've seen clusters with 8 H100s per node but only 100 Gbps Ethernet between nodes. That's a bottleneck for any model bigger than 7B parameters. You need at least 400 Gbps per node (preferably 800 Gbps) for modern LLM training.
Level 3: Distributed Training End-to-End
Now you have confidence in hardware. But real AI workloads add complexity: pipeline parallelism, tensor parallelism, ZeRO stages, mixed precision, and checkpoints.
Choose a Representative Workload
Benchmark with the model and dataset you'll actually use. If you're training LLMs, use a standard GPT-style model from NeMo or Megatron-LM. If you're doing vision, use ViT or ConvNeXt. Don't benchmark with ResNet-50 if you're going to train Llama 3.
I recommend using the MLPerf training benchmarks as reference — they're public and well-defined. For example, run the BERT-Large training benchmark on your cluster. The MLPerf v3.1 results show 1.5 seconds per training step on 8x A100. If you're slower than that, something's off.
Measure Throughput and Scaling Efficiency
Train for at least 1000 steps. Record:
- Samples/sec per GPU
- Global batch size
- Model FLOPS utilization (MFU). For H100, expect 50-60% MFU for large models.
Track scaling efficiency: if you double the GPUs, does throughput double? Common target: 90% scaling efficiency at 256 GPUs. Below 80%, you have a bottleneck — often all-reduce communication or load imbalance.
Here's a real script I've used at SIVARO:
python
# benchmark_distributed.py
import torch
import torch.distributed as dist
from torch.nn.parallel import DistributedDataParallel as DDP
import time, os

def benchmark(model, data_loader, backend='nccl'):
    rank = dist.get_rank()
    device = torch.device('cuda', rank)
    model = model.to(device)
    ddp_model = DDP(model, device_ids=[rank])

    torch.cuda.synchronize()
    t0 = time.perf_counter()
    for i, (x, y) in enumerate(data_loader):
        x, y = x.to(device), y.to(device)
        loss = ddp_model(x, y)
        loss.backward()
        if i == 100:  # warmup 100 steps
            torch.cuda.synchronize()
            t0 = time.perf_counter()
        if i == 500:  # measure 400 steps
            break
    torch.cuda.synchronize()
    t1 = time.perf_counter()
    if rank == 0:
        steps = 400
        samples_per_step = data_loader.batch_size * dist.get_world_size()
        throughput = steps * samples_per_step / (t1 - t0)
        print(f"Throughput: {throughput:.2f} samples/sec")
Don't Forget Checkpointing
Benchmark checkpoint saving and loading times. With large models (70B parameters), writing a checkpoint can take minutes. That's lost training time. Use asynchronous checkpointing or efficient serialization (safetensors). Measure with:
# Time to save a checkpoint
start = time.time()
torch.save(model.state_dict(), "checkpoint.pt")
torch.cuda.synchronize()
print(f"Checkpoint save: {time.time() - start:.2f}s")
How to Choose Between AWS and On-Premise GPU Clusters
Let's be direct. You're probably reading this because you're deciding between cloud and on-prem. I've built both.
AWS (or any cloud) wins when:
- Your workload is bursty or unpredictable. Pay-as-you-go for 1 month then shut down.
- You need latest hardware immediately. AWS launched H100 instances in late 2023. On-prem lead times in 2026 are still 12-16 weeks.
- You want to experiment with different interconnects (EFA vs. RoCE vs. InfiniBand) without buying.
On-prem wins when:
- You have constant, high utilization (>70%) for 2+ years.
- You need deterministic performance. Cloud shared tenants can cause noise. Distributed training in Amazon SageMaker AI helps with elasticity, but you can't control the neighbor's workload.
- You care about data residency or compliance.
For how to build an AWS GPU cluster for deep learning, you typically use SageMaker with its distributed training libraries, or spin up EC2 P5 instances (H100) with EFA. Cloud-native and Distributed Systems for Efficient and ... discusses how to orchestrate using Kubernetes and Ray. I prefer Ray for flexibility — you can use spot instances, auto-scaling groups, and custom network configurations.
But here's my contrarian take: Most people over-optimize for cost and under-optimize for performance on cloud. They use default EBS volumes (terrible IOPS) and don't configure EFA. If you're benchmarking a cloud cluster, you must test with EFA enabled. Without it, inter-node bandwidth drops to 25 Gbps (Ethernet) instead of 200 Gbps (EFA). That's an 8x penalty.
Common Pitfalls I've Seen (and How to Fix Them)
1. NUMA Mismatch
GPUs and their connected CPUs should be on the same NUMA node. If not, torch.cuda.synchronize() can add latency. Use numactl to bind processes.
numactl --cpunodebind=0 --membind=0 python train.py
2. NCCL Settings
Set NCCL_DEBUG=INFO during benchmarks. You'll see which algorithm and protocol are used. If you see Ring for inter-node all-reduce when you have multiple NICs, switch to Tree or NVLink-optimized paths.
export NCCL_ALGO=Tree
export NCCL_PROTO=Simple
export NCCL_NET_GDR_LEVEL=PIX
3. Network Congestion
In shared clusters, other jobs can interfere. Benchmark during quiet times, or reserve nodes exclusively. Distributed Training & Large-Scale Systems suggests using separate VLANs or SR-IOV for isolation.
4. Mixed Precision Mismatch
Benchmark both FP32 and FP16/BF16. Some clusters handle Tensor Cores differently. If your FP16 throughput isn't 2-3x FP32, you might have driver issues or not using torch.cuda.amp.
FAQ
Q: How long should a cluster benchmark take?
A: Plan for 4-8 hours. Micro-benchmarks take 30 min. Network tests take 1-2 hours. Distributed training can take 3-4 hours for a real workload.
Q: What if my cluster doesn't have InfiniBand? Can I still train large models?
A: Yes, but with degraded performance. For models under 7B parameters, 100Gbps Ethernet per node is fine. For larger, you'll need gradient compression or pipeline parallelism to hide latency.
Q: Should I benchmark with my exact training script or a standard one?
A: Both. Start with a standard benchmark (like MLPerf) to get a baseline. Then run your own. The difference tells you how much overhead your custom code adds.
Q: How often should I re-benchmark?
A: After any hardware change, driver update, or CUDA version change. Also after adding new nodes to a cluster — network topology can degrade.
Q: What tools do you recommend for visualization?
A: nsys (NVIDIA Nsight Systems) for timeline. dcgm-exporter for Prometheus metrics. wandb for training curves.
Q: How do I benchmark with multiple model parallelism strategies?
A: Use Megatron-LM's benchmark scripts. They support tensor, pipeline, and data parallelism. Run each combination and measure throughput and memory.
Q: Is it worth buying a networking switch with RoCE instead of InfiniBand?
A: In 2026, InfiniBand NDR (400Gbps) is more expensive but proven for large clusters. RoCE v2 works for up to 256 GPUs if you configure PFC and ECN. For larger, I'd go InfiniBand.
Conclusion
Benchmarking a GPU cluster isn't a one-time checklist. It's a continuous practice. Start with single-node health, then inter-node networking, then real distributed training. Use public reference results to validate your numbers. If you're slower than 80% of theoretical, stop and debug.
I've seen clusters fail not because of bad GPUs but because of misconfigured networks, wrong NCCL settings, or someone set OMP_NUM_THREADS=1 on a 128-core machine. Save yourself weeks of head-scratching and do these tests first.
And when you're ready to decide how to choose between AWS and on-premise GPU clusters, remember: benchmark both before you sign the contract. Cloud providers let you test with free credits. Vendors should let you test hardware. If they don't, walk away.
Your cluster is only as good as your benchmarks. Now go measure.
Nishaant Dixit — Founder of SIVARO. Building data infrastructure and production AI systems since 2018. Built systems processing 200K events/sec.