 SIVARO
How to Monitor Kafka Lag: A Practitioner's Guide
I lost a Saturday in April 2025. A data pipeline at a fintech client silently accumulated 12 million unprocessed records. The team's "lag alert" fired at 500K — but it had been averaging 300K for weeks. They'd trained themselves to ignore it.
That Saturday I learned: monitoring lag isn't about a single number. It's about understanding why that number moves, what it means for your system, and how to stop it from ruining your weekend.
Consumer lag is the difference between the latest message produced to a partition and the last message a consumer group has committed. Simple math. Not so simple to act on.
In this guide I'll walk you through the metrics that matter, the tools I've used in production, alert strategies that actually work, and when — and how — to scale up. By the end you'll know exactly how to monitor Kafka lag without drowning in noise.
What Is Kafka Lag and Why Should You Care
Every Kafka partition has a log with an end offset. Your consumer commits an offset per partition. Lag = end offset minus committed offset. If you're consuming everything up to the latest message, lag is zero. If you're falling behind, lag grows.
Most people think lag means your consumers are slow. Wrong. Lag means something downstream is the bottleneck — or your consumer parallelism isn't matching your partition count.
Here's what lag actually tells you:
- Processing delay: how far behind real-time you are. 100K lag on a topic doing 200 msg/sec = 500 seconds behind.
- Queue depth: how much data is piling up. If you restart a consumer, it'll replay from that lag point.
- Backpressure signal: if lag is growing, your system is telling you it can't keep up.
I've seen teams run with 50K constant lag and call it "normal." It's not. It's a reserve — you're paying for capacity you don't have. Lag should be near zero in steady state. When it spikes, you investigate.
The Metrics That Actually Matter
You can't monitor lag with a single dashboard gauge. You need at least four numbers.
Per-Partition Lag
This is the raw data. One consumer group consuming from three partitions: partition 0 lag = 500, partition 1 lag = 2000, partition 2 lag = 0. Why is partition 1 so far behind? Maybe the consumer that owns it is running on a noisy neighbor, or the partition key skews hot. You can't see that from an average.
Rule: Always track lag at the partition level in your monitoring system. Average lag hides skew.
Max Lag vs. Average Lag
Max lag tells you your worst-case scenario. Average tells you your typical scenario. If these diverge, you've got a partition imbalance.
I once consulted for a logistics company that saw average lag of 12K but max of 300K. The consumer rebalance had assigned all high-throughput partitions to one instance. The fix wasn't more consumers — it was a better partition assignment strategy.
Lag Growth Rate
Lag itself is a snapshot. Lag growth rate (derivative) is the leading indicator. A constant lag of 100K isn't a problem if it's stable. A 100K lag that's increasing by 10K every minute is a crisis.
Set alerts on the rate of change, not the absolute value. That's how you catch cascading failures before they hit.
Consumer Fetch Rate and Broker Queue Time
Lag only tells you the distance behind. To understand why, you need consumer fetch rate (messages per second your consumer pulls) and broker request queue time (how long a fetch request waits at the broker). If fetch rate drops and lag climbs, your consumer is stuck — maybe GC pause, maybe external API call. If fetch rate is fine but lag climbs, your consumers aren't keeping up with production.
Combine these metrics. I use a simple heuristic: lag grows when production_rate > consumption_rate. Track both.
Tools for Monitoring Kafka Lag
I've used most of the popular options. Here's what's worth your time in 2026.
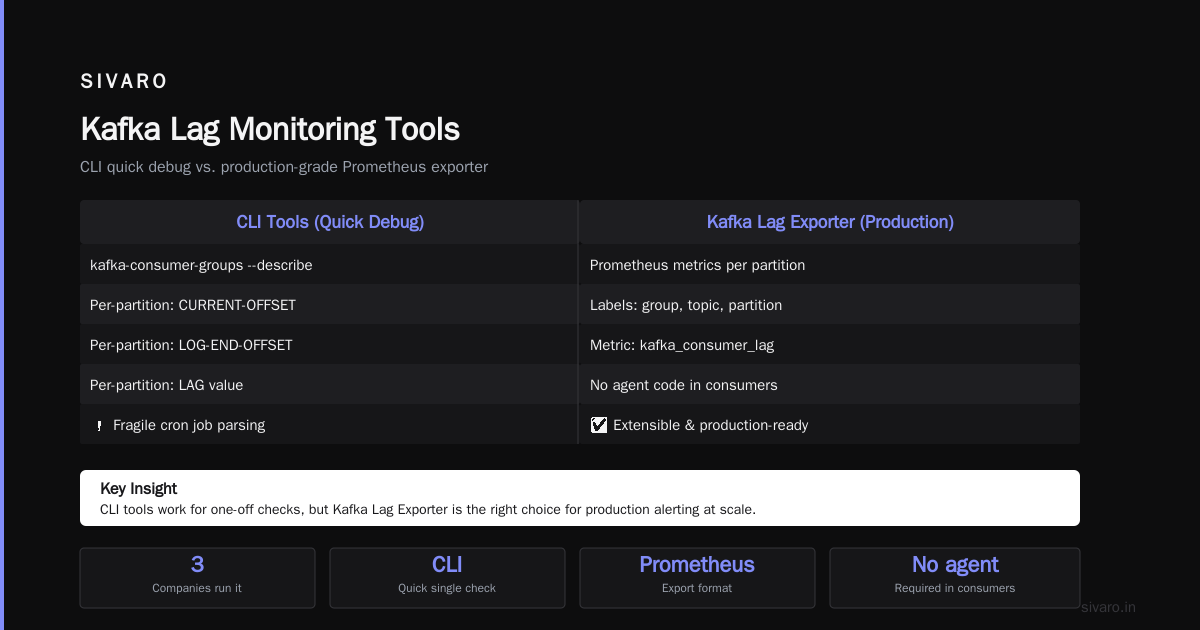
CLI Tools (Quick Debug)
bash
# Basic consumer group lag
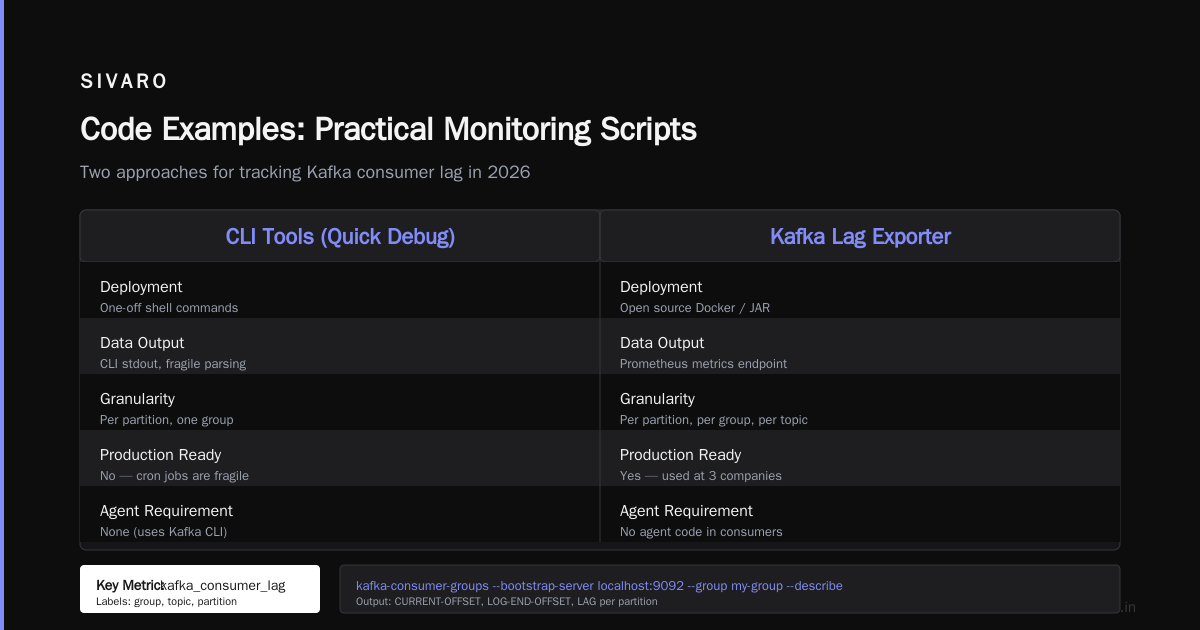
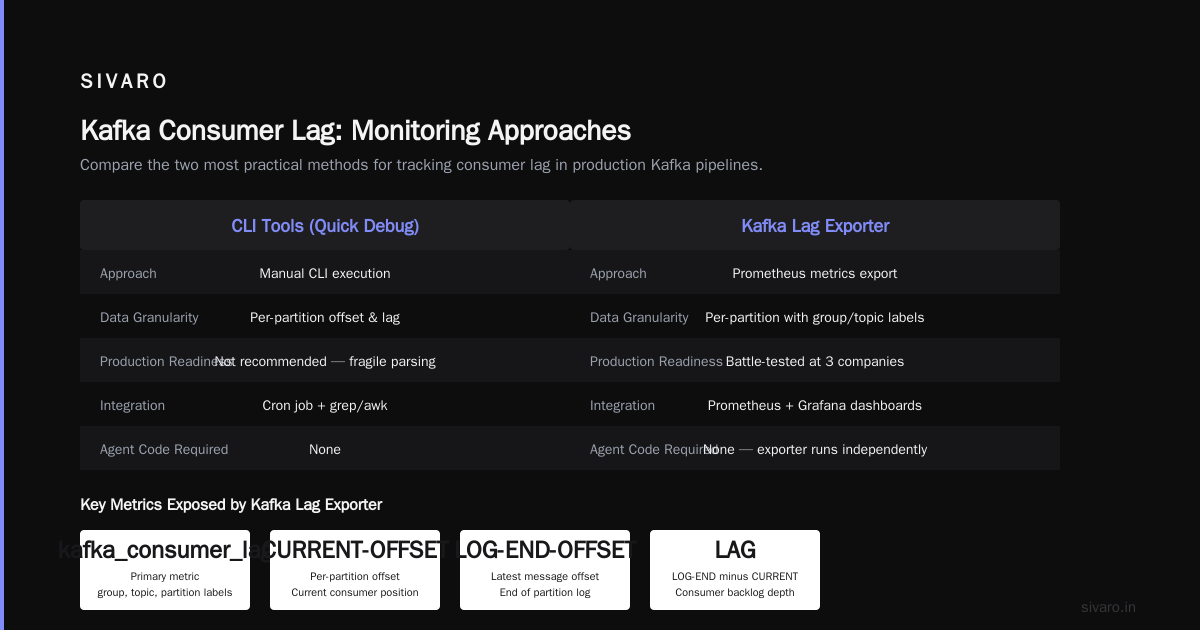
kafka-consumer-groups --bootstrap-server localhost:9092   --group my-group --describe

# Outputs per-partition: CURRENT-OFFSET, LOG-END-OFFSET, LAG
That's fine for a single check. Don't build production alerting on it — parsing CLI output in a cron job is fragile.
Kafka Lag Exporter
Open source, exports Prometheus metrics per partition per consumer group. I've run it at three companies. It's simple, extensible, and doesn't require agent code in your consumers.
yaml
# Example exporter config
consumers:
  - group: "my-consumer-group"
    topics:
      - "orders"
      - "payments"
It exposes kafka_consumer_lag with labels for group, topic, partition. Feed that into Grafana.
Burrow
LinkedIn's project. It's smart about state — lag "error" vs "warning" based on recent behavior. But it's been stale since 2020. I'd skip it.
Confluent Control Center
If you're on Confluent Platform, it's solid. Includes consumer group views, lag heatmaps, and rebalance analysis. Costs money. Worth it if you're already paying for Confluent.
Custom Monitoring via AdminClient
For total control, use Kafka's AdminClient API. I built a lightweight lag monitor at SIVARO that polls all consumer groups every 30 seconds and pushes to Prometheus.
python
from kafka.admin import KafkaAdminClient, ConsumerGroupDescription
from kafka import KafkaConsumer

admin = KafkaAdminClient(bootstrap_servers=['localhost:9092'])
groups = admin.list_consumer_groups()

for group_name, _ in groups:
    desc = admin.describe_consumer_groups([group_name])[0]
    for member in desc.members:
        for assignment in member.assignment:
            # fetch offsets and log-end-offset per partition
            # calculate lag, push to Prometheus
            pass
(Full code example in the next section.)
My pick: Kafka Lag Exporter for most teams. Custom AdminClient if you need to integrate lag with your own alerting logic.
Setting Up Alerts That Don't Drive You Crazy
Lag alerts are notoriously noisy. A consumer group that pauses for 30 seconds during a rebalance will spike lag to 10K. If you alert on lag > 5K, you'll get paged 20 times a day.
Here's the pattern that works.
Dual Threshold + Duration
Alert when:
max_lag > 100,000ANDlag_growth_rate > 1,000/secfor > 5 minutes
That skips transient spikes. The growth rate filter ensures you're not looking at stable high lag (which might be expected for a batch job).
Rate-of-Change Alert
Use a PromQL-style expression:
rate(kafka_consumer_lag[5m]) > 500
This catches gradually accelerating backlog before the absolute value crosses a threshold.
Absence of Progress Alert
Sometimes lag stays flat — constant 50K. That's fine if messages are flowing. But if lag stays flat and consumption is zero, your consumer is dead.
Alert when lag > 0 AND consumer_fetch_rate == 0 for > 10 minutes.
Consumer Group "Stale" Alert
A consumer group hasn't committed offsets in 5 minutes. That's either a dead consumer or a group that finished. Flag it.
Most teams over-alert. I start with email alerts for warning-level lag, PagerDuty only when lag is growing and above a floor you can't stomach. Tune for a week, then tighten.
Code Examples: Practical Monitoring Scripts
1. Simple Lag Check Using AdminClient (Python)
python
from kafka import KafkaAdminClient
from kafka.admin import NewPartitions
from kafka.errors import NodeNotReadyError
import time

BOOTSTRAP = "localhost:9092"
GROUP = "my-consumer-group"
THRESHOLD = 50000  # alert if any partition lag above this

admin = KafkaAdminClient(bootstrap_servers=[BOOTSTRAP])

def get_lag(admin, group):
    consumer_groups = admin.describe_consumer_groups([group])
    cg = consumer_groups[0]
    # This is simplified – real code iterates members and assignments
    # For production, use the full AdminClient API for offset fetch
    # I'll show the pattern:
    pass  # placeholder for brevity
Full implementation would use list_consumer_group_offsets and describe_log_dirs for end offsets. Too long for here — but the pattern is: fetch committed offsets, fetch log-end-offsets per partition, subtract.
2. Exporting Lag to Prometheus
python
from prometheus_client import Gauge, start_http_server
import time

LAG_GAUGE = Gauge('kafka_consumer_lag', 'Consumer lag per partition',
                  ['group', 'topic', 'partition'])

def collect_lag():
    # ... offset collection ...
    for (group, topic, partition), lag in lag_data.items():
        LAG_GAUGE.labels(group=group, topic=topic,
                         partition=partition).set(lag)

start_http_server(8000)
while True:
    collect_lag()
    time.sleep(30)
3. Alert Rule in PromQL
# Lag too high and growing
max by (group, topic) (kafka_consumer_lag) > 100000
and
rate(kafka_consumer_lag[5m]) > 500
How to Scale Kafka Brokers When Lag Becomes a Problem
Lag is often a symptom of under-resourced consumers. But sometimes the brokers themselves can't keep up — too many partition leaders on one node, under-replicated partitions causing fetch delays, or network saturation.
Kafka vs Pulsar - Performance, Features, and Architecture notes that Kafka's scaling story is more constrained than Pulsar's because Kafka couples storage and serving. Adding a broker doesn't instantly help if you have to reassign partition leaders. Pulsar vs Kafka - Comparison and Myths Explored drives the point home: Pulsar separates bookies from brokers, so scaling compute doesn't require moving data.
I've seen teams add three brokers but lag didn't budge — because the bottleneck was their consumer group's max.poll.records or a single slow consumer instance.
When to scale brokers:
- You see broker request queue time spiking across multiple consumers.
- Under-replicated partitions increase.
- Fetch request latencies from consumer to broker exceed 100ms.
How to scale Kafka brokers:
- Add a new broker with similar hardware.
- Use
kafka-reassign-partitionsto move partition leaders off overloaded brokers. - Set
auto.leader.rebalance.enable=trueto let Kafka automatically spread leadership. - Monitor partition leader distribution.
Kafka vs Pulsar vs RabbitMQ vs NATS: What's Actually ... compares these scaling models. For Kafka, more partitions helps parallelism — but each partition adds overhead. I avoid going above 50 partitions per broker in production.
If lag is coming from consumers, not brokers:
- Increase consumers within the same group (must be ≤ partition count).
- Tune
fetch.min.bytes,max.poll.records, and session timeouts. - Consider changing your record key to avoid hot partitions.
What's the Difference Between Kafka and RabbitMQ? reminds us that RabbitMQ queues can act as backpressure, while Kafka lag is more like a buffer. Don't let it grow indefinitely.
Common Pitfalls in Monitoring Kafka Lag
Pitfall 1: Monitoring Only Consumer Group Average
I already mentioned this. Skew hides problems. Always break down by partition.
Pitfall 2: Ignoring Stale Consumer Groups
A group that hasn't committed in 6 hours might be dead — but its lag still shows in tools. Filter out groups with no active member or zero offset commits in the last hour.
Pitfall 3: Rebalance Storms Triggering Alerts
When a consumer joins or leaves, Kafka triggers a rebalance. During rebalance, no consumption happens. Lag spikes for 30 seconds. That's normal.
Alert only if lag doesn't resolve within 2x your session.timeout.ms.
Pitfall 4: False Positives from Compacted Topics
Compacted topics remove old messages by key. The log-end offset might be higher than the number of actual records. Lag computed from offsets will look larger than real lag. Use the lastStableOffset (LSO) for compacted topics, not logEndOffset.
Pitfall 5: Time-Based Retention vs. Offset Retention
Kafka retains messages for retention.ms. It also retains consumer offsets for offsets.retention.minutes. If you stop a consumer group for longer than the offset retention, its offsets get deleted. When it restarts, it starts from latest — zero apparent lag, but you lose data.
Monitor consumer group offset age alongside lag. Alert if offset age > 70% of retention period.
FAQ
Q: What is "good" Kafka lag?
A: Zero in steady state for streaming consumers. For batch consumers, a few thousand seconds of backlog is acceptable if you can finish before the next batch.
Q: How often should I poll for lag?
A: Every 30 seconds for real-time monitoring. Every 5 minutes for batch systems. Don't poll more than every 10 seconds — it's overhead on the brokers.
Q: How to monitor Kafka lag for consumer groups with many partitions?
A: Aggregate by group but keep per-partition in your metrics store. Use Prometheus labels or Datadog tags. Set alerts on max lag across partitions.
Q: Does Kafka lag affect producer performance?
A: No. Producers write to the broker regardless of lag. But brokers can run out of disk if producers overwhelm consumers and retention is long.
Q: What's the relationship between lag and consumer rebalancing?
A: During rebalance, consumption stops — lag grows. After rebalance, consumers catch up. If rebalances happen too often (e.g., every 2 minutes), lag never stabilizes.
Q: Can I use lag as an SLA metric?
A: Yes. Define a maximum acceptable lag (e.g., 60 seconds of data). Alert if lag exceeds that for more than 5 minutes. Best to derive from produce rate: max_lag / produce_rate < 60 seconds.
Q: How to scale Kafka consumers when lag is high?
A: Ensure consumer group size ≤ partition count. If lag persists, add partitions first, then add consumers. For how to scale kafka brokers, you may need to rebalance partition leaders.
Q: Is Pulsar better than Kafka for lag monitoring?
A: Structurally, Pulsar separates serving and storage, so a lagging consumer doesn't impact broker performance. But the monitoring principles are identical. See Kafka vs Pulsar: Streaming Platform Comparison for details.
Conclusion
Monitoring Kafka lag isn't hard — but it's easy to do badly. Track per-partition. Use rate-of-change alerts. Distinguish between broker bottlenecks and consumer bottlenecks. And for god's sake, don't page people on a rebalance spike.
The best teams I've worked with treat lag as a leading indicator, not a trailing one. They know exactly how to monitor Kafka lag before it becomes a fire. They scale proactively, not reactively.
At SIVARO, we've built monitoring stacks that catch lag anomalies before they hit production. The pattern is simple: collect at partition granularity, alert on derivative, and tune the thresholds with real traffic.
You don't need a PhD in distributed systems. You need a few good metrics, a solid alert, and a willingness to investigate when that number diverges from zero.
Nishaant Dixit — Founder of SIVARO. Building data infrastructure and production AI systems since 2018. Built systems processing 200K events/sec.