 SIVARO
How to Monitor Kafka Performance Without the Kafkaesque Nightmare
Let me tell you about the worst Monday of my career. April 2024. A client's fraud detection pipeline went silent at 2:47 AM. Kafka was running. Brokers were alive. Consumers were connected. But nothing moved. Zero throughput. For four hours.
The senior engineer had built a beautiful Grafana dashboard. Fifteen panels. Real-time latency metrics. Consumer lag charts. Everything looked green. Everything was useless.
Because monitoring Kafka performance isn't about dashboards. It's about knowing which metrics actually predict failure — and which ones just make you feel like you're in control.
I'm Nishaant Dixit. I run SIVARO. We build data infrastructure for companies processing 200K events per second. I've seen Kafka clusters fail in ways that make Franz Kafka's novels feel optimistic (Franz Kafka). The absurdity isn't the premise — it's the debugging.
This guide is how to monitor Kafka performance like someone who's been woken up at 3 AM one too many times.
The Three Numbers That Actually Matter
Most people start with throughput. Messages per second. Bytes in, bytes out. It's the obvious thing to graph. It's also the last thing that tells you something is wrong.
Throughput drops after a problem has already broken your system. You're measuring the corpse, not the disease.
Here's what I watch instead.
Under-Replicated Partitions (URP)
This is the single most important Kafka metric. Full stop.
URP measures how many partitions don't have their full replica count synchronized. When a broker dies, URP spikes. When network partitions happen, URP spikes. When disk I/O degrades, URP climbs slowly before anyone notices.
I set alerts at URP > 0 for more than 30 seconds. Not five minutes. Thirty seconds. If replicas aren't caught up by then, you're one more failure away from data loss.
Here's how to pull it via JMX:
bash
kafka-run-class.sh kafka.tools.JmxTool   --object-name kafka.server:type=ReplicaManager,name=UnderReplicatedPartitions   --reporting-interval 1000   --one-time
The output is boring until it isn't. When you see that number go from 0 to 12, you have maybe 90 seconds before things get weird.
Request Handler Idle Percent
Most people ignore this. I don't understand why.
This metric tells you what percentage of the time your broker's network threads are actually waiting for work. If it drops below 20%, your brokers are choking on requests. They're buffering, they're queueing, they're about to fall over.
Low request handler idle + high URP = a cluster in real distress.
At SIVARO, we saw this pattern at a fintech client in 2025. Their idle was 3%. For a week. They kept adding more producers because throughput looked fine. Then a single broker had a GC pause, and the whole thing cascaded. Two hours of reprocessing.
Watch idle percent. It's the canary.
Consumer Lag in Offsets
Lag is tricky because it's normal. Every consumer has lag. The question is whether lag is growing or stable.
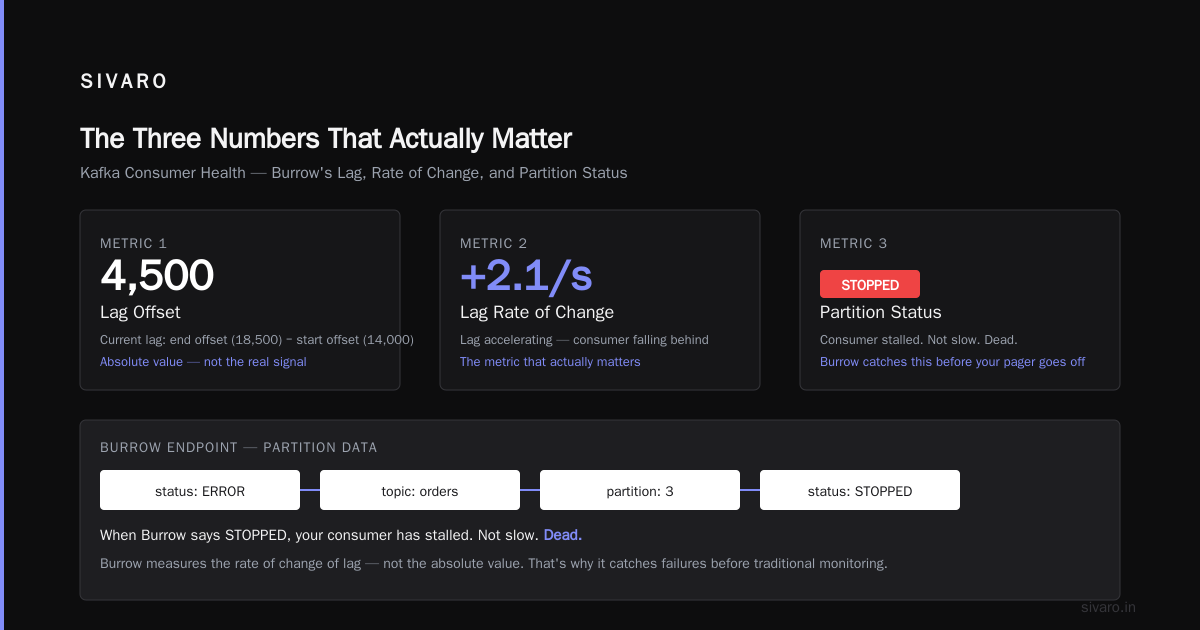
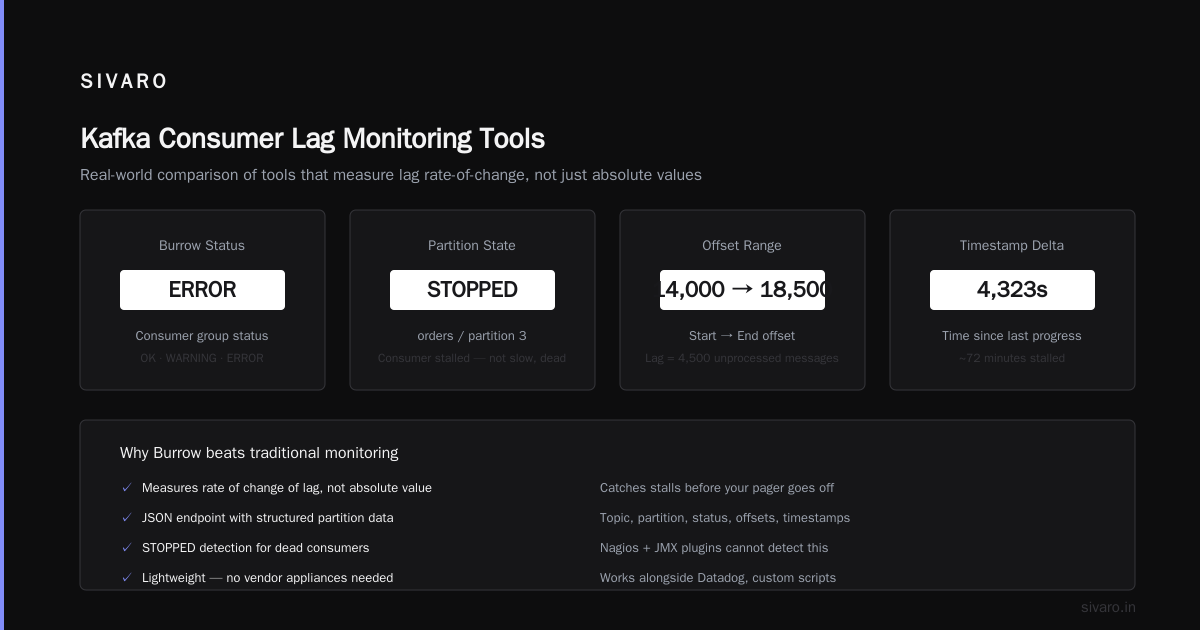
I use Burrow for this. LinkedIn open-sourced it years ago, and it's still the best tool for evaluating consumer lag. Burrow doesn't just report lag — it evaluates status. It tells you if a consumer group is OK, WARNING, or ERROR based on whether lag is accelerating.
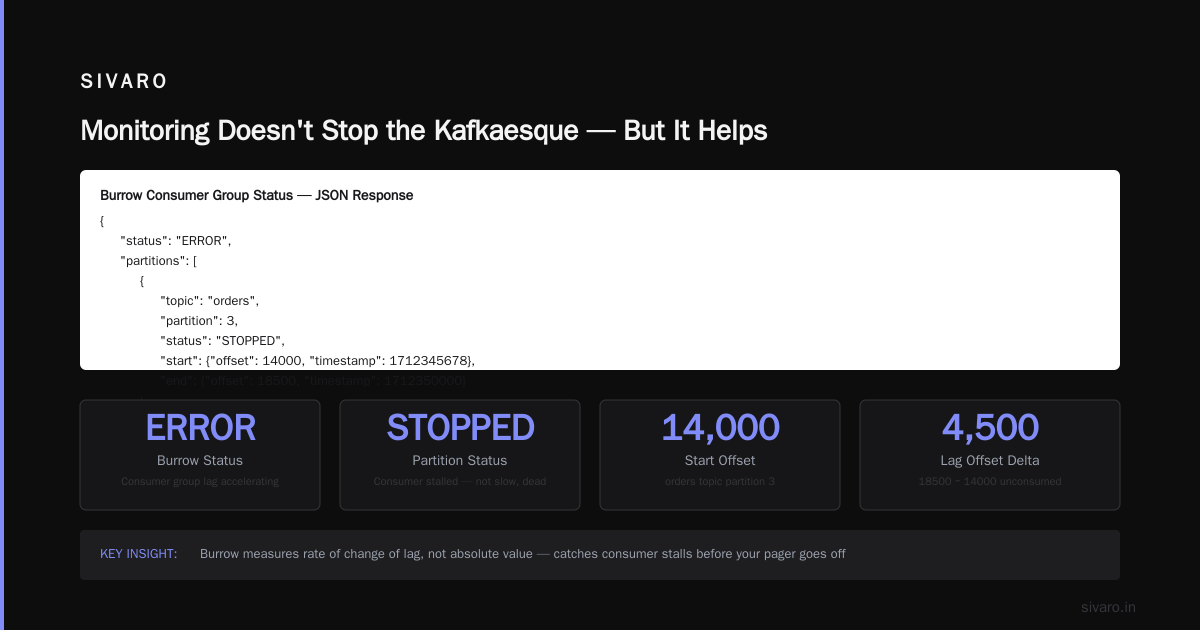
Here's the JSON you get from a Burrow endpoint:
json
{
  "status": "ERROR",
  "partitions": [
    {
      "topic": "orders",
      "partition": 3,
      "status": "STOPPED",
      "start": {"offset": 14000, "timestamp": 1712345678},
      "end": {"offset": 18500, "timestamp": 1712350000}
    }
  ]
}
When Burrow says STOPPED, your consumer has stalled. Not slow. Dead. Burrow catches this before your pager goes off, because it measures the rate of change of lag, not the absolute value.
How to Monitor Kafka Performance: The Tools That Don't Suck
I've tried everything. Nagios with JMX plugins. Custom scripts. Datadog integrations. Vendor appliances. Here's what I actually use in production.
Kafka Manager (Crucio)
Yahoo built this. It's been forked a dozen times. The version I use is Crucio, maintained by the community. It gives you cluster health at a glance — which brokers are alive, partition leadership balance, topic details.
But I don't use it for alerting. I use it for the "hmm, is something weird?" check. The partition reassignment UI alone has saved me hours.
Burrow for Consumer Monitoring
Already mentioned it. Worth repeating.
Burrow treats consumer evaluation as a state machine, not a metric. It doesn't graph lag over time. It asks: is this consumer group making progress? If not, fire the alert. Simple. Effective.
The OS Layer: What Everyone Forgets
Kafka is a JVM application running on a Linux machine. If you're not monitoring the OS, you're not monitoring Kafka.
Disk I/O wait is the silent killer. When disk write latency goes above 20ms, your producer acks slow down. Clients timeout. Retries increase. The cluster degrades gracefully until it doesn't.
I saw a cluster at an adtech company in 2024 that had 40ms average disk latency. Their Kafka was technically "healthy" — no errors, no leader changes. But throughput was half what it should have been. They'd been slowly dying for months.
Watch these OS metrics:
bash
# Disk I/O wait
iostat -x 1 | grep sda

# Page cache pressure
cat /proc/meminfo | grep -E "Dirty|Writeback"

# Network retransmits
netstat -s | grep retransmit
Dirty pages > 30% of memory? Your disk can't keep up. Retransmits climbing? Network is dropping packets.
The Producer Side: Where Most Monitoring Fails
Everything I described so far is broker-side. It's the easy part.
The hard part is producers. Because producers fail in ways that don't show up on your Kafka dashboard at all.
A producer that's sending data to the wrong topic? Kafka doesn't care. A producer that's sending 10KB messages when the max message size is 1MB? The broker rejects them silently (depending on your config). A producer that lost connectivity for 30 seconds and is now retransmitting everything? The broker sees normal traffic.
You must monitor from the producer's perspective.
I run a sidecar process on every producer host that measures:
- Ack timeout rate — messages that didn't get acknowledged in time
- Retry rate — messages that had to be retried at all
- Batch compression ratio — if it drops, something changed in your data
Here's a Python snippet I use for producer health checks:
python
from confluent_kafka import Producer, KafkaError
import json

def check_producer_health(bootstrap_servers):
    delivery_reports = []

    def delivery_callback(err, msg):
        if err:
            delivery_reports.append({"status": "error", "code": err.code()})
        else:
            delivery_reports.append({"status": "ok"})

    p = Producer({'bootstrap.servers': bootstrap_servers})

    test_msg = json.dumps({"probe": "health", "timestamp": time.time()})
    p.produce('health_check_topic', test_msg.encode(), callback=delivery_callback)
    p.flush(timeout=5)

    errors = [r for r in delivery_reports if r['status'] == 'error']
    return {
        "total": len(delivery_reports),
        "errors": len(errors),
        "error_codes": list(set(r['code'] for r in errors))
    }
If error rate exceeds 1% over 5 minutes, something is wrong. Not "something might be wrong." Something is wrong.
Consumer Group Health: The Part Everyone Skips
Producers get attention. Brokers get monitoring. Consumers? Everyone assumes they're fine until data stops flowing.
At SIVARO, we built a consumer health framework that checks three things:
- Is the consumer processing at all? (alive check)
- Is lag decreasing or stable? (progress check)
- Are there rebalances happening? (stability check)
Rebalances are the biggest silent performance killer in Kafka. Every time a consumer rebalances, all processing stops. For large groups with many partitions, a rebalance can take 30-60 seconds. If you're rebalancing every 2 minutes, your consumers spend 25% of their time doing nothing.
Monitor rebalance frequency. Any consumer group that rebalances more than once per hour has a configuration problem. Usually it's session.timeout.ms being too tight, or max.poll.interval.ms being too aggressive.
I check it with this:
bash
kafka-consumer-groups.sh   --bootstrap-server localhost:9092   --describe   --group my-consumer-group   --members --verbose
Look at the REBALANCING column. If you see it flickering, you have a problem.
The Kafkaesque Pattern: Why Failures Feel Ironic
Reading Kafka's work, you notice a pattern. The protagonist faces increasingly absurd obstacles. Each attempt to solve a problem creates a worse one. The bureaucracy is fragmented, and no single person understands the whole system (Franz Kafka - Existential Primer - Tameri).
This is exactly how Kafka cluster failures work.
I debugged a case in 2025 where a consumer group kept stalling. We checked lag — it was growing. We checked brokers — healthy. We checked producers — fine. We added more consumer instances. Lag got worse.
Turns out, the consumer was doing a database write on every message. The database had a connection pool limit of 10. Adding more consumers just meant more database contention. The database wasn't Kafka's problem. But it killed Kafka's performance anyway.
The absurdity is that Kafka performance monitoring must extend beyond Kafka itself (The Absurdity of Existence: Franz Kafka and Albert Camus). You're not just monitoring a queue. You're monitoring a pipeline — producers, network, brokers, disk, consumers, databases, APIs, everything downstream.
If you monitor only Kafka, you're going to have a bad time.
When to Stop Watching Metrics
Here's a contrarian take.
Most guides tell you to monitor everything. Every metric. Every dimension. Every partition.
I think that's a trap.
If you have 100 metrics per broker and 10 brokers, that's 1000 data points. No human can watch 1000 things. Your brain will pattern-match noise. You'll get alert fatigue. You'll miss the real signal.
I monitor exactly nine things in production:
- Under-replicated partitions
- Request handler idle percent
- Consumer group status (OK/WARNING/ERROR from Burrow)
- Producer ack timeout rate
5 Disk I/O wait on broker nodes - Network retransmit rate
- GC pause time (young + old gen)
- Leader election rate
- Topic growth rate (are we adding partitions appropriately?)
Everything else is diagnostic. I don't alert on it. I use it when I'm already investigating a problem.
Start small. Add metrics as you learn what breaks.
FAQ
Q: What's the ideal Kafka monitoring stack in 2026?
Prometheus + JMX exporter + Burrow + Grafana. That's it. Expensive commercial tools add complexity without much value.
Q: How often should I check consumer lag?
Every 10-15 seconds. Less frequent and you'll miss rapid lag growth during batch processing. More frequent and you'll overload the broker with offset requests.
Q: Should I monitor every partition individually?
No. Aggregate by consumer group. Individual partition monitoring is for debugging, not alerting.
Q: What's the most common Kafka performance mistake?
Ignoring OS-level metrics. I've seen clusters with perfect Kafka metrics that were thrashing on disk I/O.
Q: Can I use Confluent Control Center for monitoring?
You can. I don't. It's expensive and Burrow does consumer monitoring better.
Q: How do I monitor Kafka in Kubernetes?
Same metrics, but you need to handle pod restarts. Use headless services for broker discovery and persistent volumes for data.
Q: What's the first thing to check when Kafka is slow?
Check URP, then check GC logs, then check disk I/O. In that order.
Monitoring Doesn't Stop the Kafkaesque — But It Helps
You can't prevent all failures. Kafka clusters are complex distributed systems. Network partitions happen. Disks fill up. Code has bugs. Configs get misapplied.
But you can catch failures before they become outages. You can know, within 30 seconds, whether your cluster is healthy or degrading. You can sleep at night.
That's what good monitoring buys you.
The alternative is debugging at 3 AM, staring at a Grafana dashboard that shows nothing wrong while your system is silently dying. I've been there. It's Kafkaesque in the truest sense — you know something is wrong, but the system gives you no way to prove it (Franz Kafka & Kafkaesque | Making sense of Philosophy).
Don't let that be you.
Nishaant Dixit — Founder of SIVARO. Building data infrastructure and production AI systems since 2018. Built systems processing 200K events/sec.