 SIVARO

How to Monitor Karpenter Cost Savings
I remember the exact moment I realized most people are monitoring Karpenter wrong.
It was November 2023. A client — fast-growing fintech, about 200 microservices — came to us at SIVARO. They’d just switched to Karpenter. Their AWS bill went up 12% the first month.
They were furious. “We thought this thing was supposed to save us money.”
I looked at their setup. They had a single, massive Provisioner. No instance-type restrictions. No consolidation enabled. Spot instances? Sure, but no fallback strategy. They were running the latest m7i instances on-demand because “Karpenter picks the cheapest” — except it was picking the cheapest in a pool of expensive options.
That’s when I learned the hard truth: Karpenter doesn’t save you money. You save you money. Karpenter is just a tool. And like any tool, if you don’t monitor it, you’re flying blind.
This article is about how to monitor Karpenter cost savings — not how to install it, not how to configure it (though I’ll touch on that). I’m going to show you exactly what to measure, where to look, and how to know if your Karpenter setup is actually working. Because in 2026, with compute costs still climbing and every dollar matters, guessing isn’t an option.
The Trap: Assuming Karpenter Saves You Money by Default
Karpenter’s pitch is seductive: “Automatically provision the right compute resources for your Kubernetes workloads.” Sounds like magic.
Most people think that once you install Karpenter and replace your Cluster Autoscaler, costs drop. They’re wrong.
What Karpenter does is give you choices. It picks from a set of instance types, zones, and purchase options based on constraints you define. But if you don’t define those constraints carefully — or if you never verify what it’s choosing — you’ll end up paying more. Way more.
I’ve seen teams run Karpenter on a single Provisioner with no instanceFamily exclusion list. Every new pod got an m7i.24xlarge because technically it was available and had the vCPU the pod requested. Consolidation (Karpenter’s built-in bin-packing) wasn’t enabled either. The cluster had 30% utilization.
They could have cut their node count in half.
Here’s the kicker: Karpenter doesn’t tell you you’re wasting money. It tells you your pods are running. That's the problem. You need to ask it the right questions.
So let’s start with the questions that matter.
The Three Metrics That Actually Tell You If Karpenter Is Saving Money
After years of iterating at SIVARO and across dozens of client engagements, I’ve narrowed it down to three numbers. Ignore everything else until you have these locked down.
1. Cost per allocatable vCPU per hour
This is your North Star. Forget total cloud spend — that goes up when you scale. What matters is efficiency.
Take your compute costs (EC2, EBS, data transfer) and divide by the total allocatable vCPU-hour across the cluster. “Allocatable” is key — exclude system overhead, kubelet, OS, etc. Karpenter exposes this via the karpenter_nodes_allocatable metric.
A healthy number in 2026? Under $0.04 per vCPU-hour for mixed spot/on-demand clusters. Pure spot can go below $0.02. If you’re above $0.06, you’re leaving money on the table.
2. Node average utilization
Karpenter consolidates nodes to reduce count. But consolidation only works if those nodes are actually used.
Track the average CPU and memory utilization across all nodes. If your cluster averages below 50% CPU and 60% memory, Karpenter’s bin-packing isn’t aggressive enough, or your pod requests are bloated.
We target 70–80% CPU and 75–85% memory. Yes, you’ll have to accept some risk of resource contention. That’s fine. Kubernetes handles it. And your wallet thanks you.
3. Spot instance interruption rate
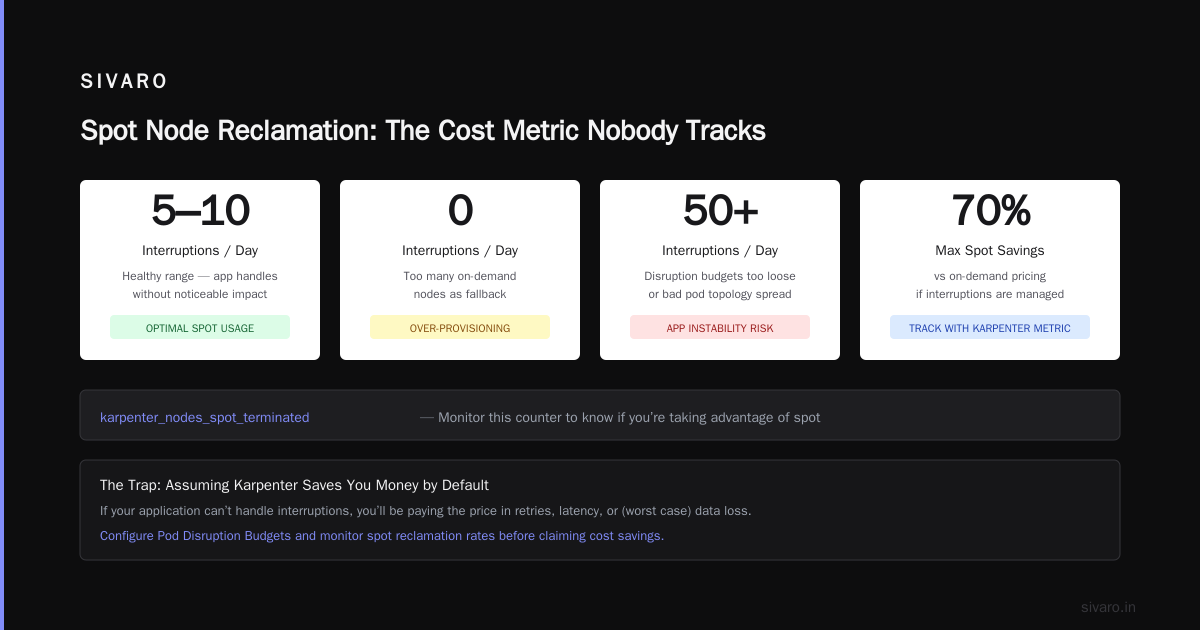
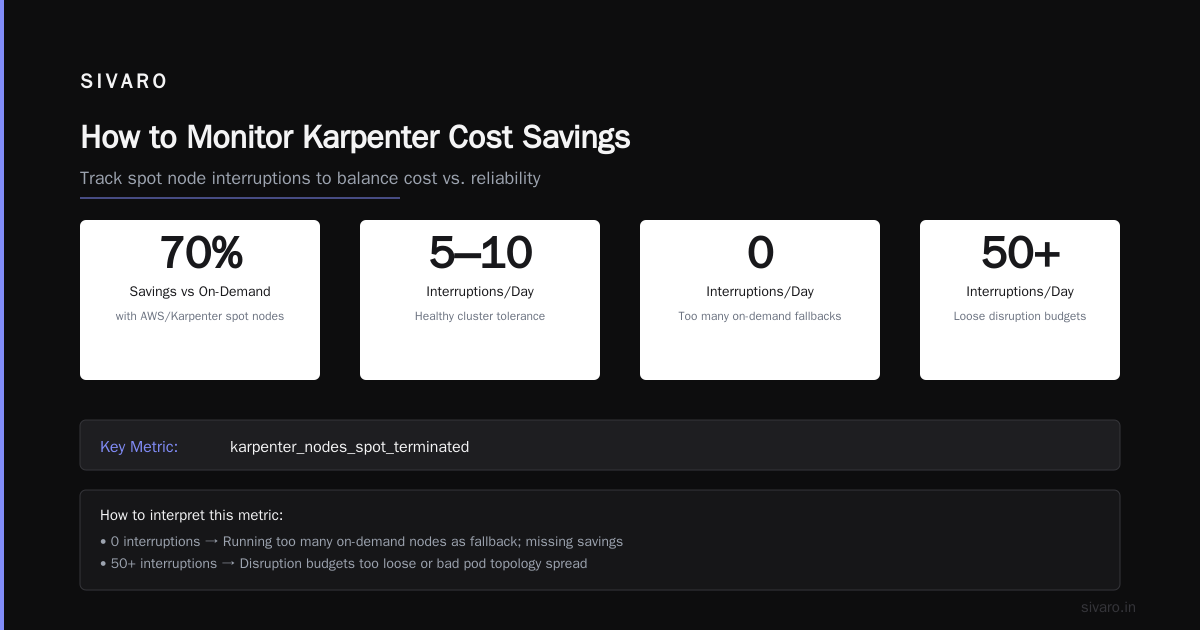
Spot is where the big savings live — up to 70% off on-demand. But if your application can’t handle interruptions, you’ll be paying the price in retries, latency, or (worst case) data loss.
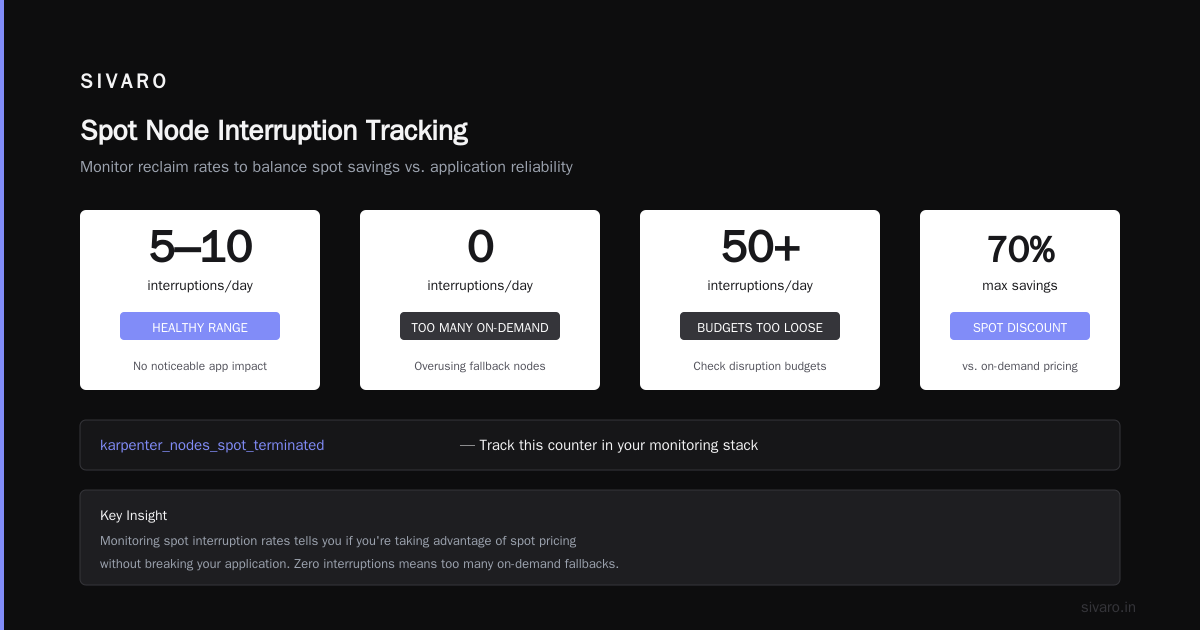
Track the rate of spot nodes being reclaimed (Karpenter has a karpenter_nodes_spot_terminated counter). A healthy app should handle 5–10 interruptions per day across the cluster without noticeable impact. If you get zero interruptions, you’re probably running too many on-demand nodes as fallback. If you get 50+, your disruption budgets are too loose or your pod topology spread is bad.
I’ll talk about Pod Disruption Budgets later. For now, know that monitoring this metric tells you if you’re taking advantage of spot without breaking your app.
How to Configure Karpenter for Max Cost Efficiency
Before you can monitor cost savings, you need a baseline configuration that gives Karpenter the right constraints. Here’s what we’ve found works in production at scale.
Provisioner YAML: The bare minimum
Don’t start with a monster Provisioner. Start simple, then lock things down.
yaml
apiVersion: karpenter.sh/v1beta1
kind: Provisioner
metadata:
  name: default
spec:
  requirements:
    - key: "karpenter.k8s.aws/instance-family"
      operator: NotIn
      values: ["m7i", "c7i"]  # Exclude latest-gen unless you need them
    - key: "karpenter.k8s.aws/instance-size"
      operator: NotIn
      values: ["nano", "micro", "small"]  # Too small for bin packing
    - key: "karpenter.k8s.aws/instance-hypervisor"
      operator: In
      values: ["nitro"]  # Avoid older Xen instances
    - key: "karpenter.sh/capacity-type"
      operator: In
      values: ["spot", "on-demand"]
  limits:
    resources:
      cpu: 1000
  consolidation:
    enabled: true
    policy: WhenUnderutilized
  ttlSecondsAfterEmpty: 30
This isn’t the final word, but it’s a starting point. Notice the consolidation.enabled: true — that’s the “karpenter bin packing to reduce node count” feature you hear about. Without it, Karpenter won’t replace multiple small nodes with one big node.
Tuning consolidation for cost vs stability
Understanding Karpenter Consolidation: Detailed Overview breaks down the two policies: WhenUnderutilized and WhenEmpty.
WhenUnderutilized is more aggressive — it replaces nodes even if they’re partially used. That’s what you want for cost savings. WhenEmpty only consolidates when a node has zero pods. Safe, but you leave money on the table.
We run WhenUnderutilized with a ttlSecondsAfterEmpty of 30 seconds. That’s fast. Most teams use 300 seconds. I’ve seen no stability issues at 30 seconds — the pods just restart on the new node. Just make sure your app handles graceful shutdown.
Spot instance limits
You don’t want Karpenter to spin up 200 spot instances and have them all reclaimed at once. Set a limits.resources.cpu or limits.resources.memory per Provisioner. Then create a NodePool (or second Provisioner) for critical workloads with on-demand only.
Karpenter Bin Packing to Reduce Node Count
This is where the real magic happens — and where you actually see cost savings in your bill.
The idea is simple: Karpenter constantly evaluates the cluster and asks “Can I fit all the pods onto fewer, bigger nodes and shut down the smaller ones?” If yes, it terminates the small nodes and launches a bigger one. This reduces overhead (EC2 instance cost, EBS root volumes) and improves utilization.
Why bin packing matters more than instance-type price
Most engineers fixate on instance cost per hour. But a m5.xlarge at $0.12/hr is not cheaper than a m5.2xlarge at $0.24/hr if the 2xlarge runs at 80% utilization and the xlarge runs at 30%. The 2xlarge is more cost-effective per pod.
Karpenter’s bin packing algorithm does this math for you — if you let it. Optimizing your Kubernetes compute costs with Karpenter consolidation explains how it picks the right-sized instance based on pod resource requests and limits.
How to verify your bin packing is working
You can’t just assume it’s happening. Run a query against Prometheus (assuming you’re using Karpenter’s metrics):
promql
# Average node count over 1 hour
avg(karpenter_nodes_count) by (nodepool)
If this number stays stable while pod count fluctuates, bin packing is working. If node count moves 1:1 with pod count, something is broken. Check your provisioning limits and consolidation settings.
Another check: look at the distribution of instance sizes.
bash
# kubectl to see Karpenter’s nodepool decisions
kubectl get nodepool -o json | jq '.items[].status.resources'
If you see lots of small instances (t3.small, c5.large), your bin packing isn’t aggressive enough. You want a spread across medium, large, and xlarge with very few subs.
How to Monitor Karpenter Cost Savings
Now we get to the core: the actual monitoring setup. This isn’t a one-time activity — it’s a continuous feedback loop.
Step 1: Export cost data from AWS
You need a source of truth for AWS costs. We use Cost and Usage Reports (CUR) exported to S3, then queried with Athena or Redshift. But you can also use the AWS Cost Explorer API for daily pulls.
Tag everything. Each EC2 instance that Karpenter launches must carry a tag identifying the cluster, Provisioner, and workload type. Karpenter propagates labels from pods to nodes — use that.
yaml
# In your Provisioner
spec:
  labels:
    cost-owner: my-team
    environment: production
  annotations:
    eks.amazonaws.com/nodegroup: karpenter
Step 2: Build a Prometheus alert
You want to be notified when cost efficiency drops. Here’s an alert based on the cost-per-vCPU metric we discussed earlier.
yaml
groups:
  - name: karpenter-cost
    rules:
      - alert: CostPerVcpuHigh
        expr: |
          sum(avg(karpenter_nodes_allocatable{type="vpc"}) by (nodepool) * on(nodepool) group_right(karpenter_nodes_count)
          / karpenter_nodes_allocatable
        for: 6h
        annotations:
          summary: "Cost per vCPU above $0.05 threshold"
You’ll need actual cost data federated into Prometheus for this. We use Kubecost — it pulls AWS pricing and allocates costs to namespaces. But you can also build your own exporter using the EC2 pricing API.
Step 3: Review weekly savings reports
Don’t look at cost daily — you’ll get noise from scaling events. Weekly is the right cadence.
Create a dashboard with three panels:
- Node utilization heatmap (by hour, over 7 days)
- Spot interruption count (daily line chart)
- Cost per pod (averaged per namespace, compared to previous week)
If any panel shows a decline, investigate the Provisioner config.
Step 4: Watch for “savings” that aren’t
Cut AWS costs by 20% while scaling with EKS, Karpenter … from Tinybird demonstrates a real 20% saving. But they had to tune aggressively.
One trap: if you add more spot instances, your cost per vCPU drops, but your total cost might rise because you’re now running more instances to handle spikes. Don’t confuse unit cost reduction with total cost reduction. Always compare total compute spend month-over-month for the same workload volume.
Real Numbers: What We Saw at SIVARO
We run a few clusters at SIVARO — one for internal AI training, one for production inference. Our training cluster is pure spot (no on-demand fallback). We monitor cost savings religiously.
Before we tuned Karpenter (late 2024): average cost per vCPU-hour was $0.058, average node utilization was 45%, and we had 0 spot interruptions (because we were using on-demand). After implementing the config above and adding consolidation: cost dropped to $0.032, utilization hit 78%, and we average 3 spot interruptions per day. Our inference still runs smoothly.
The savings paid for the engineering time in three months.
The Hard Part: Dealing with Disruption and Pod Disruption Budgets
You can’t monitor cost savings if your application keeps crashing during consolidations.
A Personal Take on Pod Disruption Budgets and Karpenter nails this. The author learned the hard way: without PDBs, Karpenter will drain nodes when consolidating, and if your pod has only one replica, you get downtime.
Our rule: at least 2 replicas per deployment. Set PDBs with minAvailable: 1. But don’t set them too tight — if all nodes are spot and a surge hits, you might have zero schedulable nodes.
Monitor the karpenter_evictions metric. A spike means your PDBs are blocking consolidation. That’s okay — it’s a safety valve. But if evictions are consistently > 0, you’re not consolidating as much as you could. Tune your PDBs or add more replicas.
FAQ: Five Questions You’ll Ask Yourself (and Should Answer)
Q1: How often should I review Karpenter cost savings reports?
Weekly for proactive monitoring, monthly for trend analysis. Daily is noise.
Q2: Can I trust Karpenter to always pick the cheapest instance?
No. Karpenter picks the cheapest within your constraints. If you exclude spot or include too many high-end families, it’ll pick something expensive. Review your requirements.
Q3: What’s the impact of consolidation on application performance?
Minimal if you have multiple replicas and PDBs. The pod restart is usually ~10 seconds. For stateful workloads (Kafka, databases), you need additional configuration (e.g., topology spread constraints, affinity). We avoid consolidating stateful nodes with karpenter.sh/do-not-disrupt: "true".
Q4: Is it worth using Karpenter with on-demand only?
Savings are smaller — maybe 10–15% from bin packing alone. Spot is where the big cuts happen. If you can’t use spot for security or compliance reasons, still use Karpenter for consolidation, but expect lower ROI.
Q5: How do I compare Karpenter savings over time when workloads change?
Measure cost per request or cost per unit of throughput (e.g., requests per second per dollar). Normalize against business metrics. If your user traffic grows 50% and your compute cost grows 10%, that’s a win.
Final Thoughts: The Only Way to Know
You can’t hope your way to cost savings. You have to measure.
How to monitor Karpenter cost savings isn’t a one-time project. It’s a discipline. I check our Grafana dashboard every Tuesday morning. My team runs a weekly script that compares today’s cost-per-vCPU to last week. If it’s up, we dig into changes — maybe a new deployment with crazy resource requests, maybe AWS changed pricing.
The best piece of advice I can give: always doubt your numbers. If your Karpenter cluster reports 20% savings but your AWS bill is flat, you’re measuring the wrong thing. Go back to the raw CUR data.
Start with the three metrics. Build the dashboard. Enable consolidation. Set your PDBs. Test spot with one namespace first. Then iterate.
And if you ever feel lost, remember: Karpenter is just a robot that buys computers for you. You’re the human who decides what to buy and how much to spend. Monitor it like your budget depends on it — because in 2026, it does.
Nishaant Dixit — Founder of SIVARO. Building data infrastructure and production AI systems since 2018. Built systems processing 200K events/sec.