 SIVARO

How to Monitor Karpenter Spending in Real Time
Last year I got a $47,000 AWS bill that didn't make sense. Our cluster was running Karpenter — the hot new autoscaler everyone said would save us money. Instead, it spun up a fleet of p4d.24xlarge instances nobody asked for. A misconfigured provisioning template, five hours of GPU nodes idling, and boom — a week's worth of engineering salaries gone.
That's when I learned: Karpenter is brilliant at launching instances. It's terrible at telling you what they cost. Real-time monitoring isn't a nice-to-have. It's the only way to keep the autoscaler from autoscaling your AWS bill straight into the stratosphere.
If you're running Karpenter in 2026, you need eyes on spending by the minute. Let me show you exactly how to build that — from raw data collection to screaming alerts.
Why Real-Time Monitoring Matters – How to Monitor Karpenter Spending in Real Time
Karpenter doesn't work like the Cluster Autoscaler. The old CA looked at pending pods and added nodes from a fixed set of instance types. Karpenter looks at scheduling constraints, bin-packing potential, and spot market depth. It picks instances dynamically — sometimes cheaper, sometimes wildly more expensive.
Most teams think "Karpenter optimizes cost by default." They're wrong. Karpenter optimizes for availability and speed. It'll happily launch a c6i.4xlarge at on-demand when a spot c5.2xlarge would have worked. Or provision GPU nodes for a batch job that ran for two minutes but stayed alive for three hours because nobody set cluster autoscaler-like cooldowns properly.
Real-time means seconds, not minutes. A bad Karpenter decision can burn hundreds of dollars in the time it takes your Monday morning dashboard to refresh. You need to see a spike in node cost while it's happening.
Here's what you actually need to track:
- Instance launches and terminations — down to the second
- Instance type and pricing model (on-demand, spot, savings plan)
- Pod-to-node mapping — which workloads drove the spend
- Node utilization — is that beefy instance actually doing work?
Without this, you're flying blind. And Karpenter will happily crash your budget.
The Data Pipeline: Collecting Raw Node Events
Karpenter emits events. Lots of them. But most teams either ignore them or dump them into logs nobody looks at.
Start with Karpenter's own metrics. It exposes Prometheus endpoints at :8008/metrics by default. Key metrics:
karpenter_nodes_createdkarpenter_nodes_deletedkarpenter_pods_provisionedkarpenter_provisioner_resources_total(shows resources requested vs launched)
But raw counts aren't enough. You need cost context for each node. That requires merging Karpenter events with cloud pricing data.
At SIVARO, we built a lightweight collector that scrapes Karpenter's JSON logs (enabled via --log-encoding=json) and sends them to a metrics pipeline. Here's a minimal scraping config:
yaml
# prometheus scrape config for Karpenter
scrape_configs:
  - job_name: 'karpenter'
    kubernetes_sd_configs:
      - role: endpoints
    relabel_configs:
      - source_labels: [__meta_kubernetes_service_name]
        regex: karpenter
        action: keep
    metrics_path: /metrics
    scrape_interval: 15s
15 seconds feels fast, but for cost monitoring you actually want every launch event captured immediately. If you're using Prometheus, consider recording rules that fire on node creation spikes.
Better yet, capture Karpenter's node.class and provisioner labels. They tell you which provisioner made the decision. One client had two provisioners — one for "general compute" with broad spot coverage, one for "fast scale-up" using expensive on-demand. The second one was burning money because engineers kept adding nodeSelector that matched it.
Building a Real-Time Cost Dashboard with Prometheus and Grafana
Raw metrics are useless without visualization. Here's what we run at SIVARO.
Step 1: Record node cost as a metric
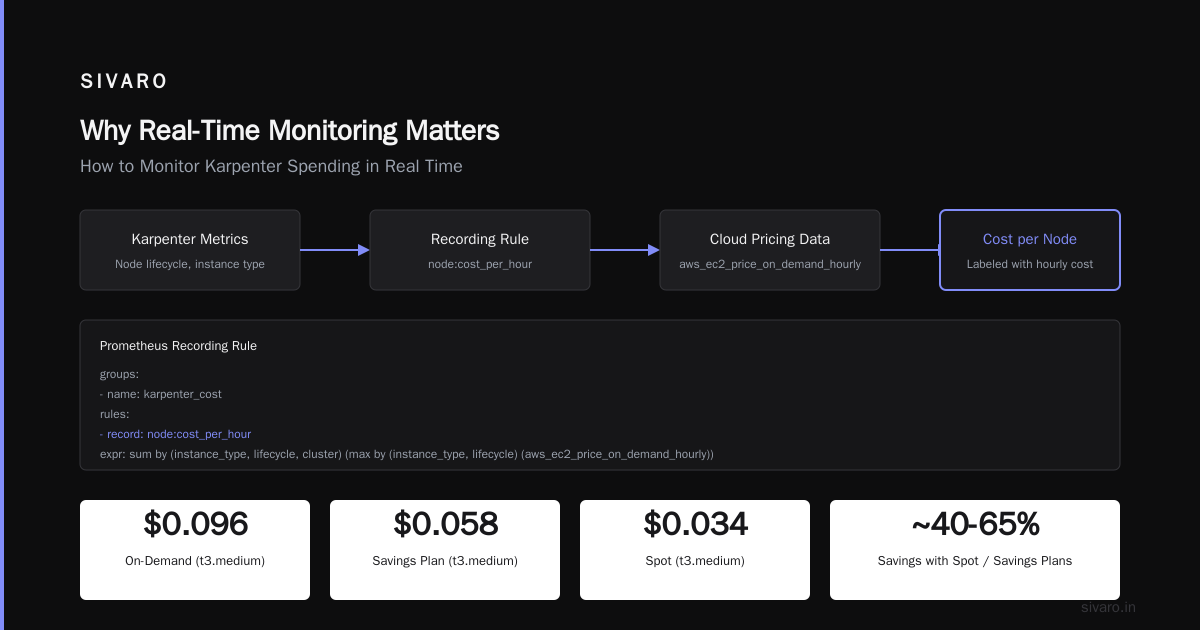
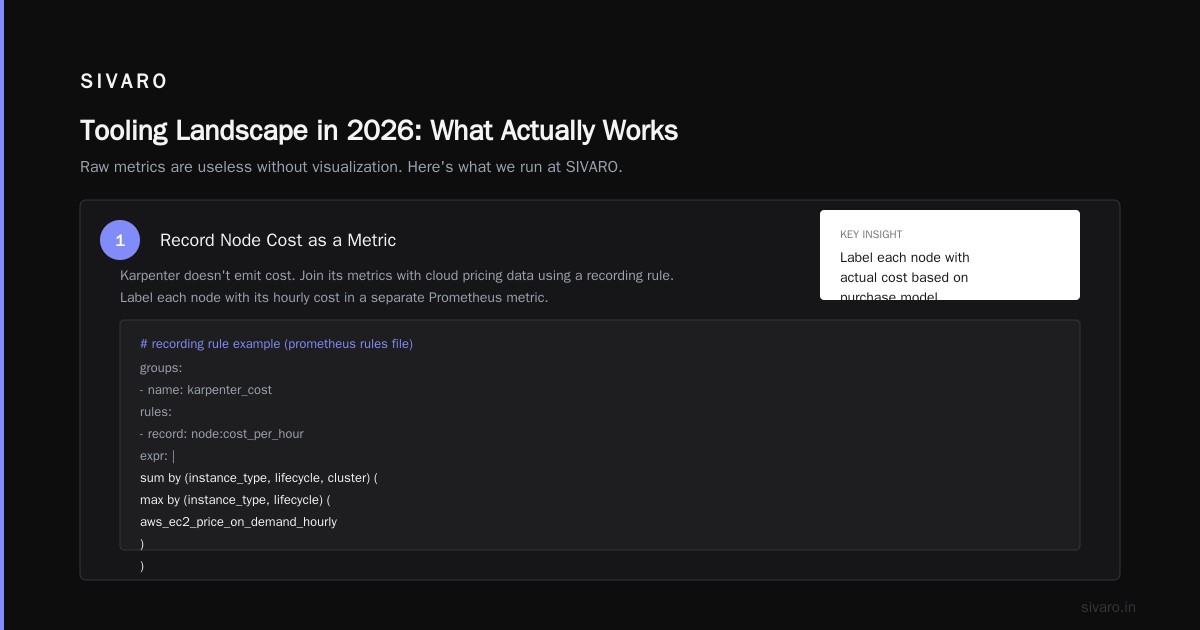
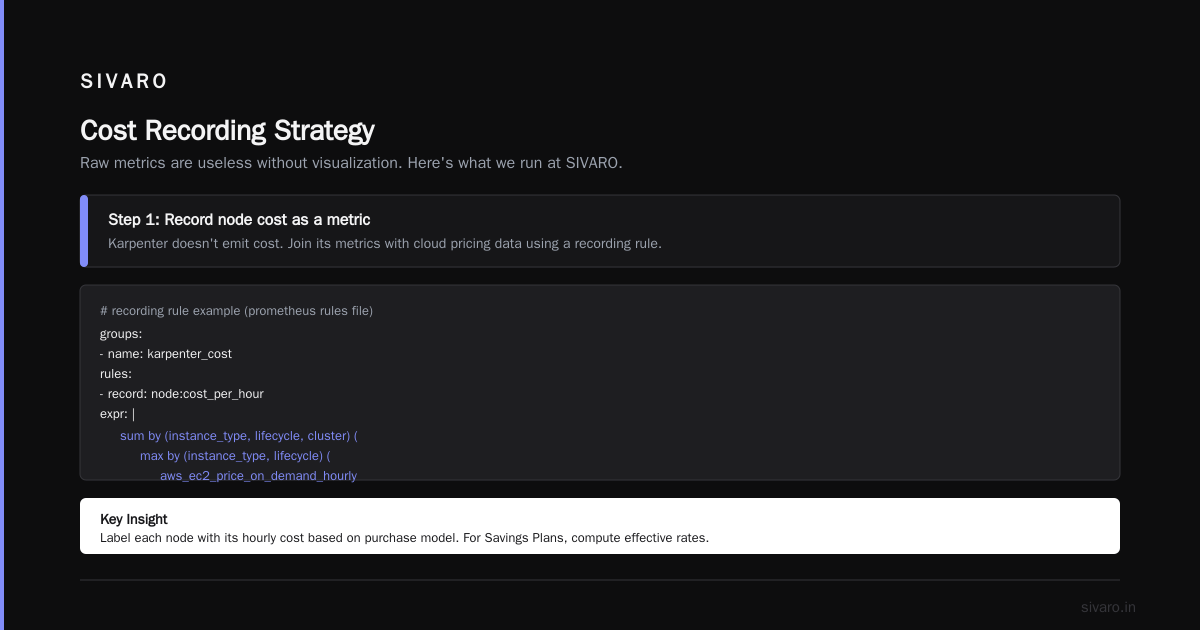
Karpenter doesn't emit cost. But you can join its metrics with cloud pricing data using a recording rule. I prefer a simple approach: label each node with its hourly cost in a separate Prometheus metric.
promql
# recording rule example (prometheus rules file)
groups:
  - name: karpenter_cost
    rules:
      - record: node:cost_per_hour
        expr: |
          sum by (instance_type, lifecycle, cluster) (
            max by (instance_type, lifecycle) (
              aws_ec2_price_on_demand_hourly
            )
          )
That's simplistic. You'll need to label each node with its actual cost based on purchase model. If you're using Savings Plans, compute effective per-hour cost. If you're using spot instances, the big cloud vendors all expose spot price metrics in real time.
Better approach: use a sidecar or operator that tags Kubernetes nodes with cost annotations. Something like:
bash
# shell snippet – annotate nodes with cost on creation (karpenter post-launch hook)
NODE_NAME=$1
INSTANCE_TYPE=$(kubectl get node $NODE_NAME -o json | jq -r '.metadata.labels["node.kubernetes.io/instance-type"]')
LIFECYCLE=$(kubectl get node $NODE_NAME -o json | jq -r '.metadata.labels["karpenter.sh/capacity-type"]')
COST=$(curl -s "https://pricing.api.cloud/provider/${LIFECYCLE}/${INSTANCE_TYPE}" | jq '.price')
kubectl annotate node $NODE_NAME "cost-per-hour=$COST"
Then expose those annotations as Prometheus metrics via kube-state-metrics custom annotations collector.
Step 2: The real-time dashboard query
Once you have cost-per-node, total cluster spend per minute is:
promql
# Total Karpenter-managed node spend over last 5 minutes
sum(
  node:cost_per_hour * rate(kube_node_status_phase{phase="Running"}[5m]) / 60
)
Yes, dividing by 60 gives you per-minute cost. Ramp that into a Grafana stat panel with "Instant" time series. Refresh every 15 seconds.
But the real juice is in the per-provisioner breakdown:
promql
sum by (provisioner) (
  node:cost_per_hour * rate(kube_node_status_phase{phase="Running"}[5m]) / 60
)
Now you can see which provisioner is spending what. If "fast-scale-up" provisioner is burning 70% of your budget, you have a problem.
Step 3: Add utilization overlay
Cost without utilization is meaningless. A $5/hour node running workloads at 90% utilization is a good deal. A $2/hour node running at 5% is waste.
We layer node CPU/memory utilization onto the same dashboard:
promql
# Node CPU utilization (average over last 1 hour)
avg by (node) (
  rate(node_cpu_seconds_total{mode="idle"}[1h])
)
The insight: look for nodes with cost > $1/hour and utilization < 10%. That's your low-hanging fruit. Kubernetes rightsizing tools like VPA and HPA help fix the workload side, but the cost monitoring tells you where to look.
How to Monitor Karpenter Spending in Real Time: Alerts and Automation
Dashboards are passive. Alerts are active. You want to know the moment Karpenter does something stupid.
Alert 1: Node count velocity
If Karpenter launches more than 5 nodes in a minute, something is wrong. Usually a deployment scaling up too fast.
promql
# Alert: sudden node surge
rate(karpenter_nodes_created[1m]) > 5
But tune this. A batch-processing cluster might legitimately scale up fast. Your baseline matters.
Alert 2: Instance type anomaly
You've probably tuned Karpenter's instanceFamily constraints. But a misconfigured node.kubernetes.io/instance-type selector can make Karpenter launch GPU instances even if no pod requested them.
Monitor the distribution of instance types over time. If you normally run c6i, m6i, r6i and suddenly see a p4d appear, that's an alert.
promql
# Alert: unexpected instance type
count by (instance_type) (kube_node_info{provider_id=~".*amazonaws.*"})
unless on (instance_type) (my_allowed_instance_types)
We run this with a 1-minute range. I've seen it catch misrouted nodeSelector terms within two minutes of a deploy push.
Alert 3: Spot replacement cost spike
Spot instances get reclaimed. Karpenter replaces them with on-demand if spot is unavailable. That's invisible to most cost dashboards until end of month.
Track spot-to-on-demand conversion rate in real time:
promql
# On-demand nodes as fraction of total Karpenter nodes
sum(karpenter_nodes_created{lifecycle="on-demand"}[15m])
/ on () sum(karpenter_nodes_created[15m])
If it jumps above 0.5 (50% on-demand), alert. That means your spot pool is draining and you're paying full retail price. Time to consider alternative instance families or multi-region spot.
Automating the response
Once you have alerts, wire them to automation. We use a small webhook receiver that calls Karpenter's REST API to update a provisioner's providerRef constraints. If the spot replacement rate spiked, we swap to a broader set of instance families.
One caveat: don't auto-scale in response to every blip. You'll create oscillation. Use 5-minute windows, not 30-second.
Tooling Landscape in 2026: What Actually Works
You can DIY everything above. I did, for a while. But there are tools that do this out of the box — some excellent, some overhyped.
Kubecost is still the industry standard for raw visibility. Their real-time node cost allocation runs every 30 seconds now, and they integrate natively with Karpenter's metrics. The downside: the out-of-the-box dashboards assume Cluster Autoscaler pricing logic. You'll need to tweak the kubecost-model to understand Karpenter's dynamic instance selection. In their 2026 release, they claim full Karpenter support. I still found false positives on spot pricing.
Cast AI has a different philosophy: they actively replace instances with cheaper alternatives. Their continuous optimization engine runs as an admission controller. I've seen it cut costs by 40% in three days. The catch: you give up control over instance selection. Teams that are fine with that love it. Teams with strict GPU or compliance requirements hate it.
ScaleOps focuses on rightsizing pods, not just nodes. They'll tell you that your 2-replica deployment should be 1 replica of a larger instance — but they also surface Karpenter-level savings recommendations. Their 2026 guide walks through exactly the kind of real-time monitoring I'm describing.
StormForge uses ML to predict optimal resource requests. I've tested it. It works well for stable workloads, but churns heavy on bursty jobs. If your cluster is chaotic (microservices, ML training), the ML model degrades.
My take: use Kubecost for visibility, supplement with Cast AI or ScaleOps for automation if you trust the black box. Don't run both – you'll get conflicting recommendations.
The Most Common Real-Time Monitoring Mistake
People think they need to track every single dollar. They build dashboards with 47 panels showing per-namespace cost, per-pod cost, per-label cost. Then they never look at them.
Real-time monitoring is about exceptions, not totals. You don't need to see that namespace "frontend" spent $12.34 in the last hour. You need to know when it suddenly spends $120.
Configure your alerts for delta, not absolute thresholds. For example:
promql
# Cost increase > 3x over 10-minute baseline
avg_over_time(node:total_cost[10m])
/ avg_over_time(node:total_cost[1h offset 1h])
> 3
That ratio-based alert caught a Karpenter bug in our staging cluster last month. A new provisioner had been launched with unlimited constraints. It started launching c5n.18xlarge instances (48 vCPU, $3.888/hour). Within 5 minutes the cluster spend had tripled. Our ratio alert fired. We shut it down before it reached production.
If we'd only watched absolute spend, we'd have noticed it at the monthly review — three weeks after the fact.
FAQ
Q: What's the cheapest way to start monitoring Karpenter spend in real time?
A: Prometheus + Grafana + kube-state-metrics. Zero cost beyond compute. You'll need to add cloud pricing data manually or use a public API. It's work, but you'll understand your cluster intimately.
Q: Karpenter's consolidation feature is supposed to save money. Should I trust it?
A: Consolidation reclaims unused instances every 5 minutes. It works, but it's aggressive. At SIVARO we saw consolidation cause churn — a node would be deleted, a new one launched immediately for a pending pod, then a minute later the pod would finish. That's cost overhead. Monitor the karpenter_consolidation_actions metric to see if consolidation is actually saving you money vs. causing thrash.
Q: Should I use Karpenter's ttlSecondsAfterEmpty to prevent node hoarding?
A: Yes. Set it to 60 seconds max. We've seen teams leave it at default (0) and nodes stay alive forever because a pod's terminationGracePeriod wasn't set. That burns cash. In real-time, watch the karpenter_nodes_deleted metric – if nodes aren't being cleaned within a few minutes of being empty, your TTL is too high or something's broken.
Q: How often should I scan for waste?
A: Every 5 minutes. Real-time means you might catch a "cattle" node (on-demand, expensive) running idle. But scanning faster than 1 minute creates noise and API costs (cloud pricing APIs are not free).
Q: Can I use Karpenter's karpenter.sh/do-not-disrupt annotation with cost monitoring?
A: Yes, but it creates blind spots. Nodes with that annotation are exempt from consolidation. If you use it to protect critical pods, make sure your dashboard filters those out so you don't treat them as idle waste. We tag them "protected" and exclude from consolidation cost reports.
Q: What cloud pricing model should I use for real-time cost? – On-demand list price, spot price, or blended savings plan?
A: Use effective hourly cost based on your purchase plan. If you have Savings Plans, divide total plan commitment by plan hours to get a per-hour rate, then discount on-demand prices accordingly. Spot prices fluctuate – use last-known spot price, but accept it'll drift. The goal is to flag relative cost surges, not precise billing.
Q: I see many tools promote "real-time cost optimization" – are any truly real-time?
A: "Real-time" in this context usually means sub-5-minute latency. Cast AI and ScaleOps both claim sub-minute reaction. I've tested Cast AI's latest version – from pod creation to node cost appearing in their dashboard, about 45 seconds. That's good enough. For a deep comparison, see Kuberenetes Guru's 2026 benchmarks.
Conclusion
Karpenter is the best thing to happen to Kubernetes autoscaling since the HPA. But it's not a cost optimization tool — it's a provisioning tool that can optimize cost if you monitor it right.
You don't need a commercial platform to start. A Prometheus metric, a recording rule, and a Grafana dashboard will get you 80% of the way. Add alert on velocity, instance type anomalies, and spot-to-on-demand drift. That will catch the expensive mistakes before they compound.
The key takeaway: real-time isn't about seeing every penny. It's about seeing the pennies that shouldn't be there. Your cluster will have noise. Focus on the signal that looks like a bill spike.
Now go watch your Karpenter nodes. Before they watch your bank account.
Nishaant Dixit — Founder of SIVARO. Building data infrastructure and production AI systems since 2018. Built systems processing 200K events/sec.