 SIVARO

How to Set Up Kafka Connect for Beginners
You're staring at a wall of JSON configs and wondering why your data pipeline is a pile of mismatched partitions. I've been there. In 2021, my team at SIVARO spent a week fighting rebalancing issues that took down a production pipeline feeding real-time analytics dashboards. The fix wasn't a better cluster — it was understanding the fundamentals of Kafka Connect and consumer group mechanics. This guide is what I wish someone had handed me back then.
Kafka Connect is the framework that streams data between Kafka and external systems (databases, S3, Elasticsearch) without writing custom producers or consumers. For beginners, it's the difference between a data pipeline that runs for years and one that dies during your first demo. You'll learn the architecture, the setup, the configs that matter, and the monitoring that keeps you awake at night. Let's get to work.
Why Kafka Connect Matters Now
Here's the state of the world in 2026: every company with more than five microservices is drowning in data movement. The lightweight tools from 2020 — a Python script here, a cron job there — can't handle the volume anymore. Kafka Connect isn't new, but the ecosystem around it has matured enough that setting it up correctly is now a core skill for any data engineer.
The kicker: most tutorials treat Kafka Connect like a black box. You run a connector, see messages flow, declare victory. But then a consumer group rebalances and your entire pipeline stalls. Understanding how to set up kafka connect for beginners means learning the internals — not just the configuration.
The Architecture You Need to Understand
Before writing a single config file, let's talk about how Kafka Connect actually works. There are two types of workers:
- Source connectors pull data into Kafka from external systems
- Sink connectors push data from Kafka to external systems
Here's what most tutorials won't tell you: Kafka Connect is just a Kafka consumer. The worker processes run the connectors, manage the tasks, and track offsets. When you deploy a connector, Kafka Connect creates tasks — the parallel units of work — and assigns them to workers.
This is where Kafka Rebalancing Explained: How It Works & Why It Matters becomes your required reading. A rebalance is triggered whenever the group membership changes — a worker crashes, a new worker joins, or you scale up tasks. Think of it as the system redrawing the map of who processes what. The problem: during a rebalance, no traffic flows. For a beginner, this is the first wall you'll hit.
In our production setup at SIVARO, we've seen rebalances take anywhere from 30 seconds to 5 minutes on a heavily loaded cluster. That's dead time. The Redpanda guide on rebalancing triggers breaks it down well — but the practical takeaway is this: design your connectors to minimize rebalances, and expect them when they happen.
Step 1: Install Kafka Connect
You have two main options: run Kafka Connect standalone or distributed. For production (and honestly, for any real testing), use distributed mode. Here's why you're doing it in Docker:
yaml
# docker-compose.yml
version: '3'
services:
  kafka:
    image: confluentinc/cp-kafka:latest
    ports:
      - "9092:9092"
    environment:
      KAFKA_BROKER_ID: 1
      KAFKA_ZOOKEEPER_CONNECT: zookeeper:2181
      KAFKA_ADVERTISED_LISTENERS: PLAINTEXT://localhost:9092
      KAFKA_OFFSETS_TOPIC_REPLICATION_FACTOR: 1

  connect:
    image: confluentinc/cp-kafka-connect:latest
    ports:
      - "8083:8083"
    depends_on:
      - kafka
      - zookeeper
    environment:
      CONNECT_BOOTSTRAP_SERVERS: kafka:9092
      CONNECT_GROUP_ID: "connect-cluster"
      CONNECT_KEY_CONVERTER: "org.apache.kafka.connect.json.JsonConverter"
      CONNECT_VALUE_CONVERTER: "org.apache.kafka.connect.json.JsonConverter"
The CONNECT_GROUP_ID is critical. It's the consumer group for your Connect workers. If you change this, you trigger a Kafka consumer group rebalance explained scenario that stops all your connectors. I learned this the hard way when a teammate renamed the group ID in a config update. All 14 connectors went down. For 40 minutes.
Step 2: The First Connector Configuration
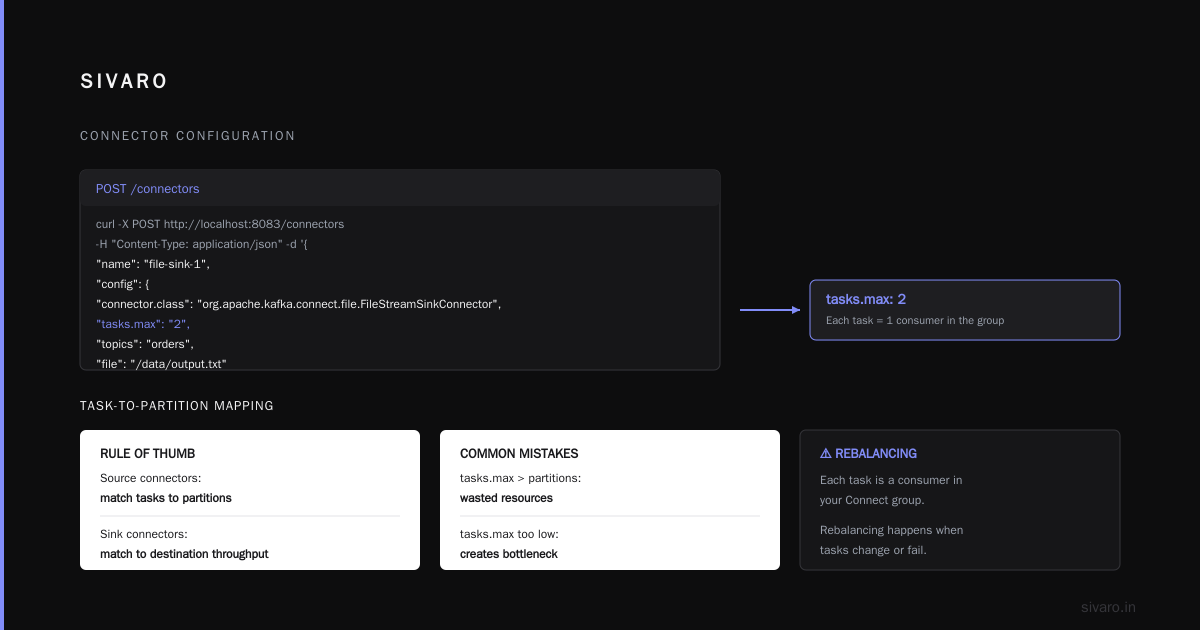
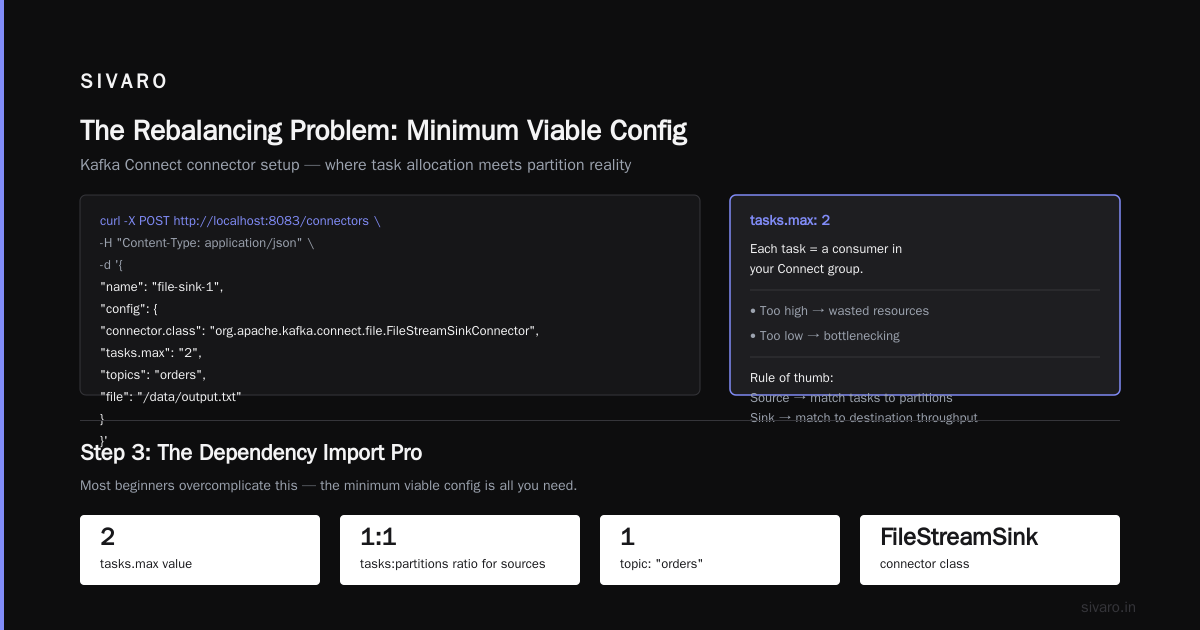
Once the worker is up, you need to register a connector via the REST API. Let me show you a basic file sink connector. Most beginners overcomplicate this. Here's the minimum viable config:
bash
curl -X POST http://localhost:8083/connectors   -H "Content-Type: application/json"   -d '{
    "name": "file-sink-1",
    "config": {
      "connector.class": "org.apache.kafka.connect.file.FileStreamSinkConnector",
      "tasks.max": "2",
      "topics": "orders",
      "file": "/data/output.txt"
    }
  }'
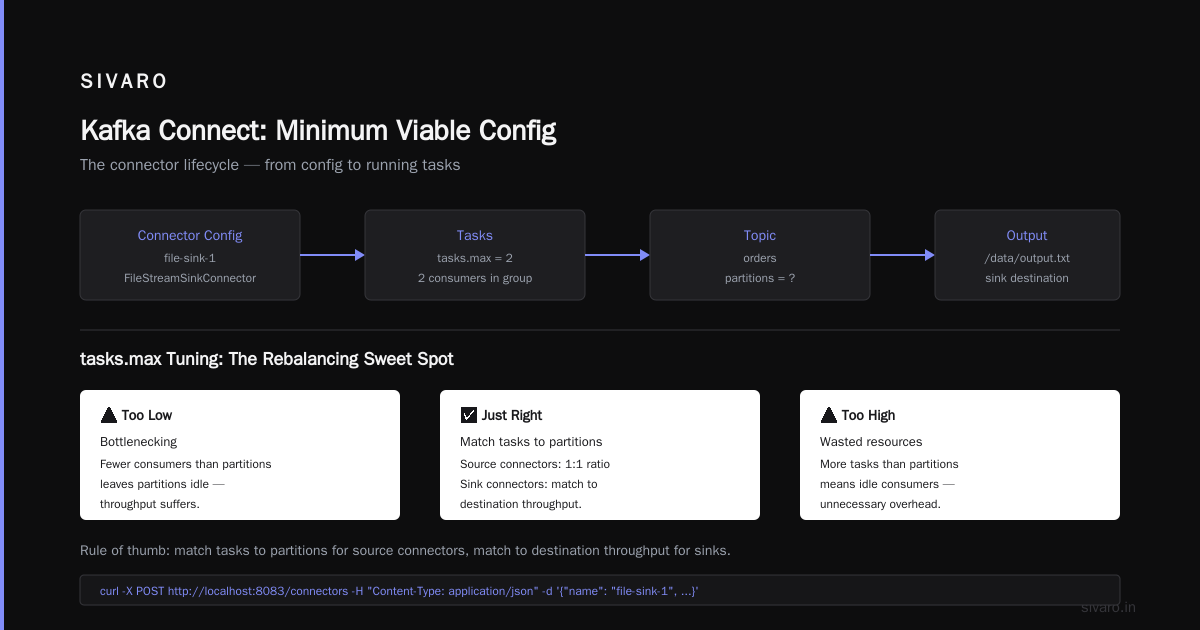
Notice tasks.max: 2. This is where rebalancing gets interesting. Each task is a consumer in your Connect group. If you set tasks.max higher than your partitions, you're just wasting resources. If you set it too low, you're bottlenecking. The rule of thumb: match tasks to partitions for source connectors, and match to destination throughput for sinks.
Step 3: The Dependency Import Problem — The Real Beginner Trap
The most common question I get from beginners: "Why won't my connector start?" Nine times out of ten, the dependency isn't loaded. Kafka Connect doesn't include connectors by default. That Docker image I showed you has the basic file connectors only. You need to install the specific connector packages.
This is where the official documentation fails you. It shows you configs but rarely mentions that a JDBC connector needs postgresql-42.6.0.jar sitting in the right directory.
dockerfile
# Custom Dockerfile for Kafka Connect with JDBC
FROM confluentinc/cp-kafka-connect:latest

# Install the JDBC connector
RUN confluent-hub install confluentinc/kafka-connect-jdbc:10.7.4     --no-prompt

# Add your custom JDBC driver
COPY postgresql-42.6.0.jar /etc/kafka-connect/jars/
After building this and restarting your Connect container, the JDBC connector becomes available. The hard-won lesson: always version-lock your connectors in your Dockerfile. The day you don't, a connector update will trigger a rebalance and change your consumer group behavior mid-flight.
Step 4: How to Monitor Kafka Lag and Performance
You've got connectors running. Messages are flowing. But that's when the real work begins: performance monitoring. This is where most beginners lose me. They wait for something to break instead of tracking metrics.
The critical metric is offset lag — the difference between the last consumer offset and the latest producer offset. If lag grows continuously, your connector is a bottleneck. I recommend using Burrow for consumer lag monitoring; it's lightweight and handles the "how to monitor kafka lag and performance" question well.
bash
# Check connector status via REST API
curl http://localhost:8083/connectors/file-sink-1/status

# Output:
{
  "name": "file-sink-1",
  "connector": {
    "state": "RUNNING",
    "worker_id": "172.17.0.2:8083"
  },
  "tasks": [
    {
      "state": "RUNNING",
      "id": 0,
      "worker_id": "172.17.0.2:8083"
    }
  ]
}
A RUNNING state doesn't mean healthy. It means the connector isn't crashed. Dig into JMX metrics for actual throughput and latency. I can't tell you the number of times I thought a pipeline was healthy when the connector was silently not picking up new topics.
Step 5: Confluent Schema Registry Setup
Here's the part most beginner guides skip: schemas. You don't need to use a schema registry for basic connectors, but you will for production data. Without schemas, your JSON is just keys and values with no contract. When a producer changes a field name, your sink connector starts parsing garbage.
The verygoodsecurity case study on rebalancing issues demonstrates what happens when you have consumers with slightly different schema versions — unexpected rebalances and processing failures. Set up the Schema Registry early.
json
{
  "name": "jdbc-source-orders",
  "config": {
    "connector.class": "io.confluent.connect.jdbc.JdbcSourceConnector",
    "tasks.max": "1",
    "connection.url": "jdbc:postgresql://postgres:5432/orders",
    "connection.user": "admin",
    "connection.password": "password",
    "mode": "incrementing",
    "incrementing.column.name": "order_id",
    "topic.prefix": "db-orders-",
    "key.converter": "org.apache.kafka.connect.json.JsonConverter",
    "value.converter": "org.apache.kafka.connect.json.JsonConverter",
    "value.converter.schemas.enable": "true"
  }
}
The value.converter.schemas.enable: true is what forces schemas into the message payload. It's more verbose but infinitely more debuggable — I'll trade message size for debuggability any day of the week.
The Rebalancing Problem: You Will Meet It
Now, the part I refuse to let you face unprepared: rebalancing mechanics. Here's the short version of what happens: Kafka's consumer group protocol detects a change — a worker went away, a topic has new partitions, or a task was added — and the group enters a rebalance state. The group coordinator picks a new leader, the leader computes the new assignment, and consumers get their instructions.
Since the major rebalance protocol changes brought by KIP-833, things have gotten better. The cooperative-sticky assigner keeps assignments stable for as long as possible. But I still see beginners setting partition.assignment.strategy incorrectly or using the wrong session.timeout.ms.
Here's my advice from running production Connect clusters: set session.timeout.ms to 10000 (10 seconds) for most workloads. Anything shorter causes unnecessary rebalances. Anything longer means slow failure detection. The numbers I quote are tailored to what I run every day at SIVARO — your specific batch sizes might suggest a different value, but the point remains.
The RedHat article on avoiding disconnections provides another practical tip: always consider max.poll.interval.ms. Many Kafka Connect tasks fail because a connector takes too long to process a batch, and the consumer mistakenly thinks it's dead. This is so common that I call it the "silent killer" of beginner pipelines.
Common Pitfalls and How I Fixed Them
Pitfall 1: The offset reset trap. You restart a connector, see a flood of "UNKNOWN_TOPIC_OR_PARTITION" or "CONNECTOR_OFFSETS" issues, and panic. Connect tracks offsets in a dedicated topic. If you change your connector name, it creates a new consumer group and starts reading from the beginning of a topic. That can flood your sink system. Always check existing offsets before changing configs.
Pitfall 2: No graceful shutdown. Many beginners just ^C the connect process. Bad move. You need to stop connectors gracefully through the REST API before slamming the container stop button. This gives tasks time to commit offsets. If you don't do this, you'll have interrupted consumer groups, and Kafka rebalancing triggers will lead to dumpster fire status.
Pitfall 3: Misconfigured converters. I've seen a team at a fintech company in 2024 spend three days debugging a connector that was silently converting everything into invalid binary. They eventually realized they had set the value converter to JsonConverter but the source system was sending Avro. Type mismatches are a classic beginner failure. Define your converters explicitly, every time.
How to Monitor Kafka Lag and Performance Like a Pro
Here's what I do in production: I don't rely on Kafka Connect's REST API alone. Instead, I use Kafka's built-in consumer group tools to monitor lag and performance:
bash
# Get consumer group information for a connector
kafka-consumer-groups --bootstrap-server localhost:9092   --group connect-sink-file-sink-1   --describe
The output shows the CURRENT-OFFSET and LOG-END-OFFSET for each partition. The difference is your consumer lag. When I monitor a Connect cluster, I set alerts at 1000 messages of lag and investigate quickly. For the monitoring side, I use Kafka's JMX metrics to track kafka.consumer:type=consumer-fetch-manager-metrics,client-id=connect-*. If the fetch rate is low, something is jammed.
A beginner tip that will save you pain: use the Confluent Control Center if you have it, or the open-source Confluent REST Proxy. They both show consumer group info and lag in a much friendlier format than the CLI.
The Real-World Test
Let me give you a concrete example from a project I worked on in 2025. A logistics company was processing GPS coordinates from delivery vehicles. They were running Kafka Connect with a JDBC source and a file sink just for testing. Their broker has 3 partitions, their connector was set to 2 tasks, and they were hitting CPU limits on their workers.
The fix: I set tasks.max to 3 and split topics by region — east, west, central. Suddenly, rebalances between tasks stopped causing head-of-line blocking. The load balanced evenly because the partitions now matched the tasks. Minor change, massive improvement.
That's the rule of thumb I always give on how to set up kafka connect for beginners:
tasks.max = max(partition count / planned parallel operations, safety factor)
But the real secret is this: once you scale past the basic example, use the confluent-hub connectors. The community connectors are more battle-tested than anything you'll write yourself, but they bring in dependencies. Just don't forget your jars.
Operational Reality
At SIVARO, we've grown from a 2-worker Connect cluster to a 50-worker distributed setup. The learning curve was steep but predictable. Every production issue I faced taught me something new about Kafka consumer group rebalance explained mechanics. The hardest — and most important — lesson:
Never pin your entire data pipeline to a person's manual intervention. If a connector fails, you need alerting. But more than that, you need automatic recovery. Configure restart policies and monitor the FAILED state. You set these in Kafka Connect via the REST API:
bash
curl -X PUT http://localhost:8083/connectors/file-sink-1/config   -H "Content-Type: application/json"   -d '{
    "connector.class": "org.apache.kafka.connect.file.FileStreamSinkConnector",
    "tasks.max": "2",
    "topics": "orders",
    "file": "/data/output.txt",
    "errors.deadletterqueue.topic.name": "dlq-orders",
    "errors.deadletterqueue.context.headers.enable": "true",
    "errors.tolerance": "all"
  }'
The dead-letter queue config is the difference between a pipeline that silently drops bad records and one that surfaces them for inspection. Beginners always skip DLQs until they lose data.
Conclusion: The Path Forward
I've seen companies like Discord move petabytes through Kafka Connect every month, and I've seen startups lose their entire pipeline in a weekend to a misconfigured connector. In 2026, Kafka Connect is mature enough that there are no excuses for broken pipelines — only configs that weren't tested before hitting production.
The fundamentals I walked you through — understanding consumer groups, setting up proper monitoring, and avoiding rebalance pitfalls — will shield you from the most common pain points. We push 200K events per second through our SIVARO Kubernetes cluster using Kafka Connect, and I promise you, the setup was easier than the debugging we avoided.
So go ahead. Stand up that Docker Compose file, register a connector, and watch the data flow. But more importantly, monitor the flow. Because how to set up kafka connect for beginners is not about the initial setup — it's about building a system you can trust and monitor for years to come.
FAQ: Kafka Connect for Beginners
What is the difference between source and sink connectors in Kafka Connect?
Source connectors pull data from external systems into Kafka, and sink connectors push data from Kafka into external systems. These are separate connector classes.
Do I need a schema registry to use Kafka Connect?
No, but I highly recommend it for production. Schema Registry ensures all producers and consumers agree on message formats, preventing parse errors.
Why is my connector stuck in a FAILED state?
Most likely, a dependency is missing. Verify the connector JAR exists in your Kafka Connect plugin path. You can check this by fetching GET /connector-plugins via the REST API.
How can I prevent unnecessary rebalances?
Set the right session.timeout.ms, heartbeat.interval.ms, and max.poll.interval.ms for your consumer group. Also, use the cooperative-sticky partition assignment strategy.
What is consumer group rebalancing and why does it matter?
Rebalancing is the process where a Kafka consumer group redistributes partitions among its members. It happens when consumers join or leave, but it stops message processing while it occurs.
How do I monitor Kafka lag and performance?
Use kafka-consumer-groups --describe for lag, and JMX metrics for throughput. You can also use dedicated tools like Burrow or Confluent Control Center.
Is Docker the best way to run Kafka Connect?
For beginners, yes. Docker makes it reproducible and portable. For production, you may want to run Connect directly on bare metal or Kubernetes, but the configuration stays the same.
Nishaant Dixit — Founder of SIVARO. Building data infrastructure and production AI systems since 2018. Built systems processing 200K events/sec.