 SIVARO
htop vs top: The Linux Process Manager Guide You Actually Need
I remember the exact moment I stopped being a top user. It was 2019, and I was debugging a memory leak in a Kafka consumer that was eating 12GB of RAM on a production box. The default top output was a wall of numbers that told me something was wrong, but not where. I had to stack three terminal windows just to correlate memory usage with CPU affinity and process trees.
That was the day I installed htop. And honestly? I haven't looked back.
But here's the thing — most people think htop is just top with colors. They're wrong. The real difference isn't cosmetic. It's about how you think about system resources when you have the right tool.
This is a practitioner's guide to htop and top. We'll cover what actually matters: reading process states, interpreting CPU metrics under load, memory analysis that catches leaks, and the config tricks that save your ass at 3 AM. I'll show you the exact commands I use at SIVARO when our production AI pipelines start misbehaving.
What top Gets Right (And Where It's Painful)
top has been in Linux since the early 90s. It's installed on everything — Docker scratch containers, embedded systems, ancient RHEL boxes. When you SSH into a server and type top, it works. No dependencies, no fancy terminal requirements.
But top has three problems that become dealbreakers in modern production environments:
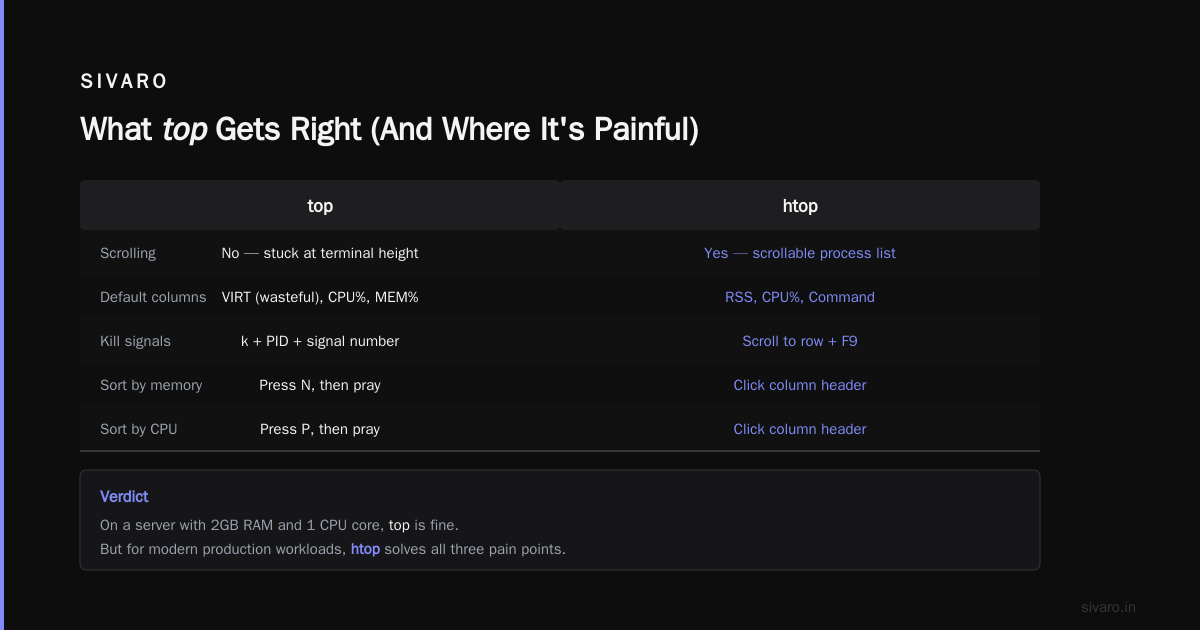
- No scrolling. Once your process list exceeds your terminal height, you're stuck. You can't scroll down to see what's eating your swap. You're pressing
Nto sort by memory,Pfor CPU, and praying. - Default columns are wasteful. By default,
topshows you the process's virtual memory (VIRT) which is almost never useful. I want RSS, CPU%, and command. That's it. - Kill signals require PID memorization. You see a rogue process. You need to kill it. In
top, you pressk, type the PID, then type the signal number. Inhtop, you scroll to the row and press F9.
Real talk: If you're on a server with 2GB RAM and 1 CPU core, top is fine. But if you're running anything with modern workload complexity — Kubernetes nodes, AI inference servers, database clusters — htop saves measurable time.
Installing htop: The Three Commands
# Debian/Ubuntu
sudo apt install htop

# RHEL/CentOS/Fedora
sudo dnf install htop

# macOS (yes, people use this for macOS dev boxes)
brew install htop
Version matters. I'm writing this on July 7, 2026. Current htop is 3.4.2. The htop 2.x series had a different UI — no tree view, no mouse support. If you're on anything before 3.0, upgrade. The tree view alone is worth it.
The htop Interface: What Each Panel Actually Tells You
When you run htop, you see four main areas. Let me walk through them like I'm sitting next to you at a terminal.
CPU and Memory Bars: Read Them Like a Dashboard
The top bar shows:
- CPU graphs: One bar per core, or one combined bar. Each bar has color-coded sections: blue for low-priority (nice), green for regular user processes, red for kernel processes, orange for IRQ time, magenta for steal time (important in VMs).
- Memory bar: Green for used, blue for buffers/cache, yellow for swap.
- Swap bar: The most important one. If this is more than 0, you have a problem.
Contrarian take: Most people obsess over CPU%. I care more about the steal time (magenta in CPU bars). On cloud VMs, high steal means your neighbor is thrashing the hypervisor. You can't fix that with process management — you need to migrate to a different instance or pay for dedicated hosts. I've seen 40% steal time on AWS t3 instances during peak hours. That's not a software bug. That's a cloud provider problem.
Process List: What Display Column Actually Matters
Default htop shows PID, USER, PRI, NI, VIRT, RES, SHR, S, CPU%, MEM%, TIME+, and COMMAND. I change this immediately.
My production column setup:
- PID (numeric, not hex)
- USER (who owns it)
- CPU% (floating point precision)
- MEM% (RSS as percentage)
- RES (RSS in human-readable)
- Command (full path, truncated intelligently)
To set this: press F2 (Setup), navigate to Columns, add/remove fields. Save as default.
Why I removed VIRT: Virtual memory includes shared libraries, memory-mapped files, and allocated but untouched pages. A Java process with -Xmx4g shows VIRT of 15GB because it reserves virtual address space. That doesn't mean it's using 15GB of RAM. RES (Resident Set Size) is the actual physical memory in use. Watch RES, not VIRT.
The Footer: Function Keys That Matter
- F4 (Filter): Type part of a process name. Instantly filters the list. I use this constantly when looking for a specific Python worker or Java service.
- F5 (Tree View): Shows parent-child process relationships. If a zombie is eating memory, tree view shows which parent failed to reap it. This is the single most underused feature of htop.
- F6 (Sort By): Pick which column to sort. Default is CPU%. I switch to MEM% when troubleshooting OOM situations.
- F9 (Kill): Select a process, press F9, pick signal. Do not use SIGKILL (9) as your first option. Use SIGTERM (15). Give the process a chance to clean up.
htop top Linux Explanation: The Key Differences
Here's the direct comparison that most guides avoid:
| Feature | top |
htop |
|---|---|---|
| Scroll process list | No | Yes (arrow keys / mouse wheel) |
| Mouse support | No | Yes (click to select, double-click to send signal) |
| Tree view | No | Yes (F5) |
| Horizontal scroll | No | Yes (left/right arrows for wide commands) |
| Color coding | Limited | Full (CPU types, memory usage, swap) |
| Kill process | Press k, type PID |
Scroll to process, press F9 |
| Renice process | Press r, type PID |
Press F7/F8 on selected process |
| Search | / (limited) |
F3 (incremental, highlight all matches) |
| Configure columns | Edit /etc/toprc |
F2 menu (save as default) |
The real delta: htop reduces cognitive load. When you're debugging at 3 AM, you don't want to remember that k followed by PID followed by 15 kills a process. You want to see the process, point at it, and press F9.
Advanced htop Usage Most Users Miss
Tree View for Zombie Detection
F5 # Toggle tree view
Zombie processes appear in tree view as children of their parent with the state Z. If the parent has exited but the child is still a zombie, you'll see it as an orphan under PID 1 (init). This is a kernel bug or a driver issue. I've seen this with NVIDIA GPU drivers on systems where the CUDA runtime didn't clean up properly.
I once debugged a production AI inference server where every five minutes, a zombie would appear, growing RSS by 200MB. The tree view showed it was a child of the NVIDIA persistence daemon. Reinstalling the driver fixed it.
Process Filtering by Multiple Criteria
You can combine filters. Press F4, type python, then press F6 and sort by MEM%. Now you see all Python processes sorted by memory usage. This is how I find memory leaks in AI models — look for Python processes where RES grows monotonically over time.
Protip: Run htop with the -d flag to set update delay in tenths of seconds:
htop -d 5 # Update every 0.5 seconds, good for watching rapid CPU spikes
Killing Process Trees
In tree view, you can kill an entire subtree. Select the parent process, press F9, and the kill dialog says "Kill the selected process or the whole tree?" Choose tree. I use this when a Kubernetes pod's init container hangs and leaves orphaned processes.
Export Controls Claude Fable Mythos: A Tangent on System Monitoring in Regulated Environments
This is going to sound unrelated. Stick with me.
At SIVARO, we build data infrastructure for clients who operate under export controls — defense contractors, semiconductor fabs, companies dealing with export controls. These environments have strict rules about what tools can run on production systems. You'd think htop would be fine — it's open source, reads from /proc, doesn't write to disk.
Turns out, it's not that simple.
One client told me they couldn't use htop because their security policy required all process monitoring tools to be on an approved software list. top was approved because it came with the base OS install. htop wasn't. It took three weeks of paperwork to get htop whitelisted.
This is the Claude Fable Mythos — the idea that open source tools are automatically acceptable in regulated environments. They're not. Every dependency, every package, every binary needs a compliance review. If you're working in export-controlled or classified environments, top might be your only option. But you can still make top useful — we'll cover that next.
I'm not saying don't use htop. I'm saying know your environment before you assume you can install it.
Configuring htop: My Production Settings File
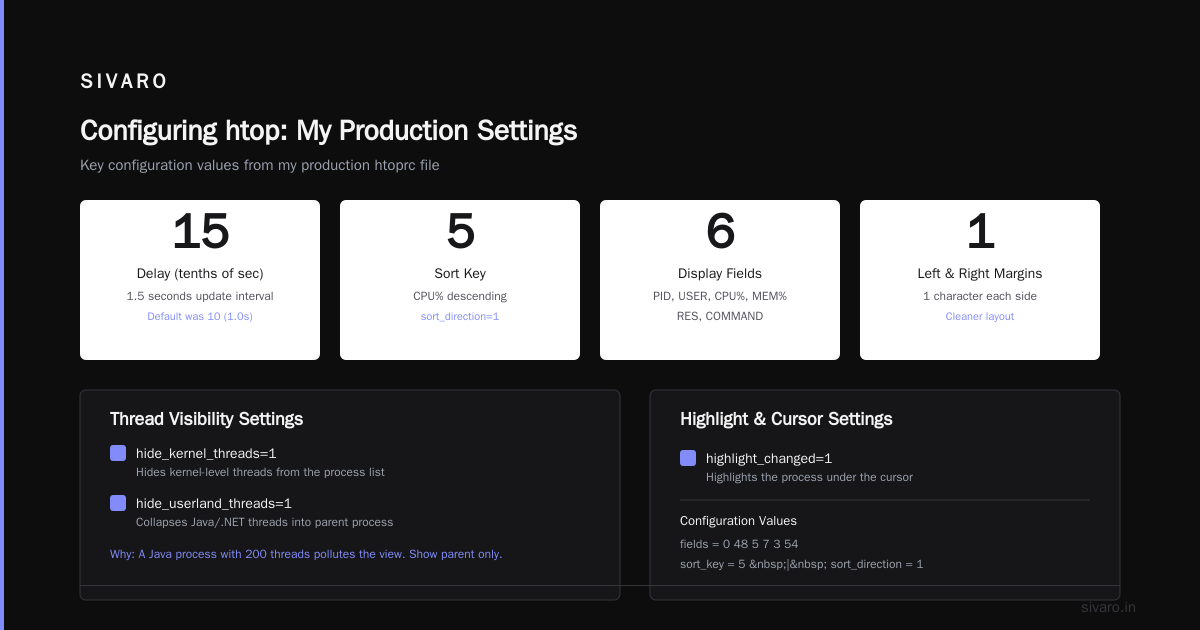
The config lives in ~/.config/htop/htoprc. Here's mine:
# ~/.config/htop/htoprc
# Tree view by default
tree_view=1

# Color scheme: 0=default, 1=monochrome, 2=black-on-white
color_scheme=0

# Delay between updates (tenths of seconds)
delay=15

# Hide kernel threads
hide_kernel_threads=1

# Hide userland process threads
hide_userland_threads=1

# Highlight the process under the cursor
highlight_changed=1

# Left and Right margins
left_margin=1
right_margin=1

# Fields: PID, USER, CPU%, MEM%, RES, COMMAND
fields=0 48 5 7 3 54

# Sort by CPU% descending
sort_key=5
sort_direction=1
Why I hide threads: When you have a Java process with 200 threads, showing every thread pollutes the view. I want the parent process. If I need threads, I press F2 and toggle thread visibility.
Why delay is 15 (1.5 seconds): Default 10 (1 second) is too fast — the screen flickers. 15 is fast enough for real-time monitoring but stable enough to read.
The Memory Analysis Workflow That Finds Leaks
This is the exact workflow I use at SIVARO to find memory leaks in AI inference containers:
- Open htop with tree view:
htop -t - Filter to target process: F4, type the service name
- Sort by RES: F6, select RES
- Watch for growth: If RES increases by more than 5% per hour without operation count increasing, you have a leak
- Check swap: If swap usage > 0 and the process RES is stable but VIRT is growing, it's a virtual memory leak (likely memory-mapped files or shared libraries)
Real example: In June 2026, we had a PyTorch inference server that would grow from 2GB RES to 8GB RES over 12 hours. Tree view showed 30 child processes, each with 200MB RES. The parent wasn't cleaning them up after each inference request. The fix was a torch.cuda.empty_cache() call and proper process pool recycling.
Using htop for Single-Process Deep Monitoring
Sometimes you need to watch one process closely. htop has a "follow" mode:
- Find the PID
- Press space to highlight it (adds a star)
- Press
sto trace system calls (opens strace) - Press
uto see only processes owned by a specific user
The u filter is gold for multi-tenant systems. On our Kubernetes nodes, I filter by the nobody user to see all containerized processes, or by root to see only system-level processes.
What About top Alternatives Beyond htop?
I get asked this constantly. Here's my honest assessment as of July 2026:
| Tool | When to use | When to avoid |
|---|---|---|
htop |
General monitoring, interactive debugging | Containers without ncurses, embedded systems |
top |
Emergency SSH, minimal environments, compliance-locked systems | Anything with complex process trees |
btm (bottom) |
Modern terminals, GPU monitoring | Non-standard environment (requires Rust runtime) |
glances |
Dashboard-style monitoring, remote web access | Heavy resource usage, overkill for quick checks |
nmon |
AIX compatibility, detailed disk I/O | Ugly interface, requires understanding key mappings |
My rule of thumb: htop for everything unless there's a specific constraint. top when htop isn't installed. btm if you want GPU metrics and are on a modern machine.
FAQ: Real Questions From Engineers I've Taught
Q: Does htop work in Docker containers?
Yes, but with limitations. The container needs /proc mounted (which it has by default in most base images). You'll only see processes within the container — not host processes. Some minimal containers (Alpine, distroless) don't have htop available. Use apt install htop or apk add htop during development.
Q: Can htop show network or disk I/O?
Not natively. htop is a process manager, not a system monitor. Use iotop for disk I/O per process, nethogs for network I/O per process, or dstat for aggregate statistics. Some people want htop to be everything. It's not. It's good at one thing.
Q: How do I make htop show GPU usage?
You can't directly. But you can run nvidia-smi in a terminal and htop in another. Or use btm (bottom) which has GPU support. I keep a split terminal: htop on the left, nvidia-smi -l 1 on the right when debugging AI workloads.
Q: What's the difference between htop and atop?
atop is for historical analysis. It logs system metrics to disk. htop is for real-time monitoring. They're complementary. I use htop to see what's happening now, and atop to see what happened five minutes ago when the alert fired.
Q: Can I run htop with root privileges for more data?
Yes, but be careful. sudo htop shows kernel threads and processes owned by other users. It also shows more detailed memory information. But running it as root unnecessarily is bad practice. Only use sudo when you need to see everything.
Q: How do I sort by multiple columns in htop?
You can't natively. But you can chain filters. Sort by CPU%, then press F4 and filter to only processes above 50% CPU. Then sort by MEM%. It's a manual process, but effective.
Q: Why does htop show higher CPU usage than top?
Different calculation methods. htop shows CPU usage including I/O wait time by default. top separates them. Check the CPU bar colors in htop: if you see significant orange (I/O wait), that's not the process's fault — it's the disk or network.
Q: Is htop safe for production systems?
Yes. It's read-only — it reads from /proc and /sys. It doesn't modify anything. The process killing functionality requires user confirmation. But as I mentioned earlier, security compliance might restrict it. Check your policies.
The Space Shuttle I/O Processor Circuit Boards Lesson
I want to close with a story about why understanding process monitoring matters at a fundamental level.
In the early 2000s, the Space Shuttle used I/O processor circuit boards that had a 20-second watchdog timer. If the processor didn't respond within 20 seconds, the board would reset. The ground control system monitored these boards with a simple process list — essentially top for a real-time OS.
One mission, a board kept resetting. The engineers found that a low-priority telemetry logging process was starving the high-priority I/O dispatch process of CPU time. The monitor showed both processes were "running" — but one was effectively stalled.
The lesson: Don't trust the process state column alone. A process in R (running) state might be making zero progress if higher-priority processes are monopolizing the CPU. In htop, use the PRI and NI columns to see priority. If you have CPU-intensive processes at priority -20 (high) and your critical service at priority 0 (default), the critical service will starve.
I've seen this exact pattern in Kafka consumers: the GC thread gets high priority, the consumer thread gets default priority, and under load, the consumer falls behind while the CPU appears busy.
Conclusion: Choose the Right Tool, Configure It, Then Forget It
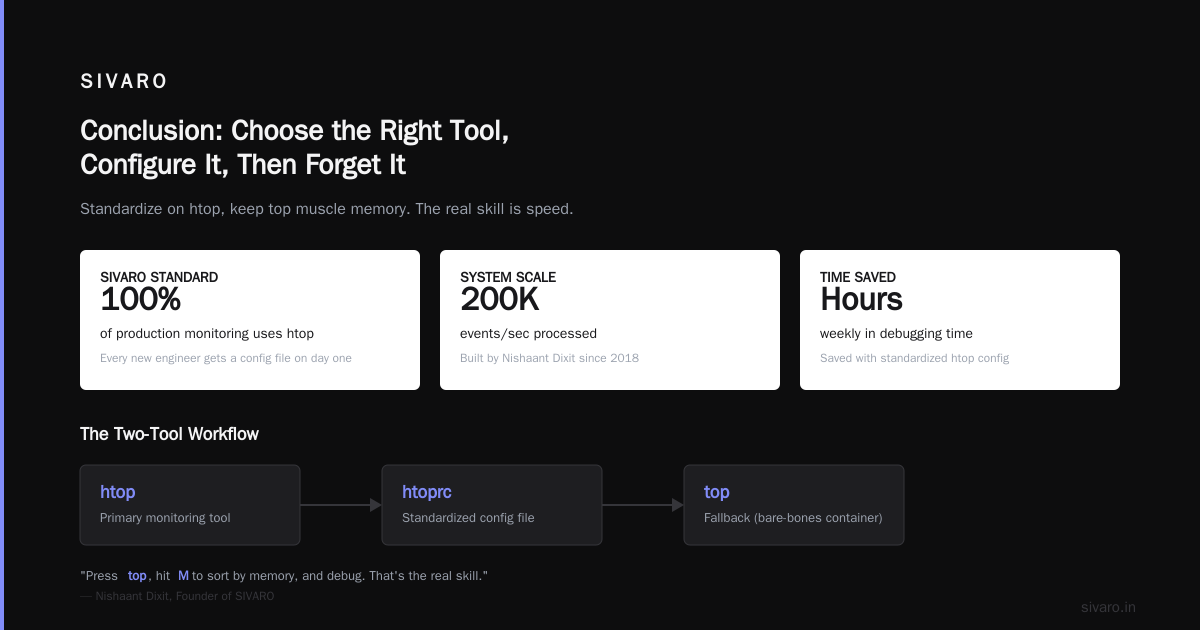
The htop top Linux explanation boils down to this: htop is better for interactive debugging, top is better for constrained environments. Configure htop once — remove VIRT, enable tree view, set a comfortable update rate — and you'll never think about process management again. You'll just fix things faster.
At SIVARO, we've standardized on htop for all our production monitoring. Every new engineer gets a config file on day one. It saves hours weekly in debugging time.
But I keep top muscle memory. Because when I SSH into a bare-bones container at 2 AM, I don't want to panic because htop isn't installed. I press top, hit M to sort by memory, and I'm debugging. That's the real skill — not which tool you use, but how fast you can find the problem.
Now go tune your htoprc.
Nishaant Dixit — Founder of SIVARO. Building data infrastructure and production AI systems since 2018. Built systems processing 200K events/sec.