 SIVARO
Kafka Lag Monitoring Best Practices That Actually Work
You’re running twenty microservices, each consuming from Kafka. One day your payment pipeline stalls. Orders pile up, the UI shows "processing" for hours, and your on-call gets pinged at 3 AM. You check the consumer group lag — it’s in the millions. You’ve been watching it passively, but you didn’t know what to do with it. I’ve been there. At SIVARO, we’ve built and operated data infrastructure for clients processing 200K events/sec. Kafka lag is the symptom — but monitoring it correctly requires understanding the disease.
This guide is about kafka lag monitoring best practices — not the theory, but what I’ve learned running production clusters since 2018. We’ll cover what lag means, how to measure it, the metrics that matter, alerting strategies, and the ugly side of rebalances. You’ll also see how consumer group rebalancing can destroy your lag numbers, and why you need to think about exactly-once semantics and security alongside lag monitoring. By the end, you’ll know how to detect problems before they burn you, and how to tell if your lag is normal or dangerous.
What Kafka Lag Actually Means (And Why Most People Misread It)
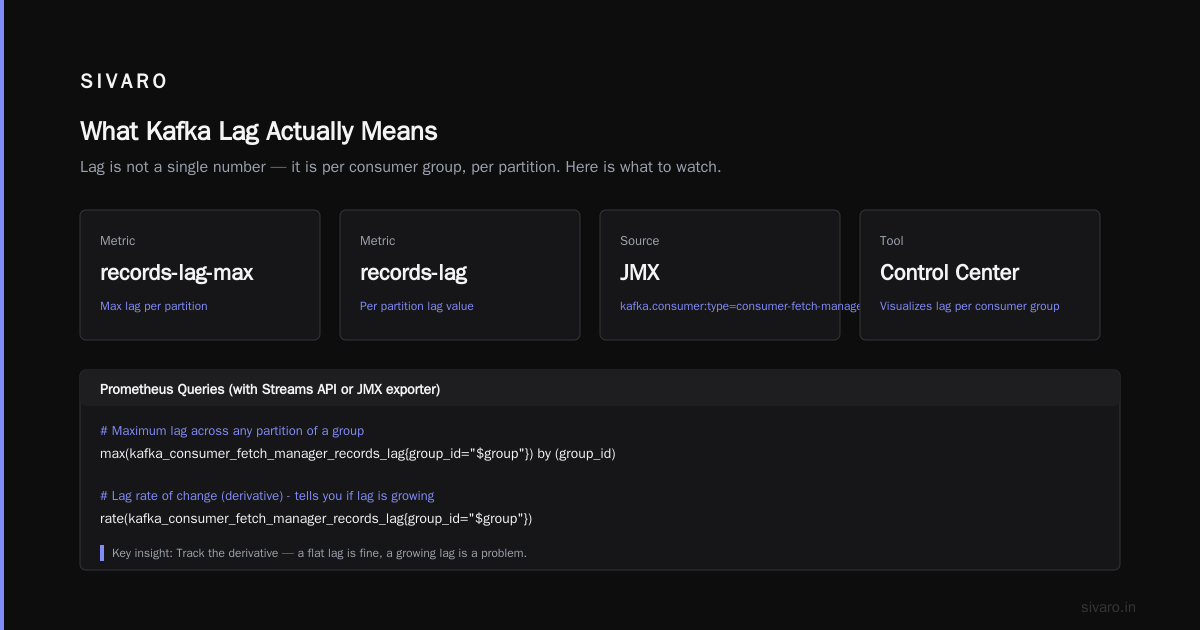
Kafka lag is the difference between the last offset produced to a partition and the offset your consumer has committed. Simple enough. But it’s not a single number — it’s per partition, per consumer. And not all lag is created equal.
I’ve seen teams panic because lag on a given partition hit 100K, only to realize that partition had a burst of 200K messages in the last hour and the consumer was keeping up just fine. Lag is a time-series signal, not a static snapshot. The rate of change matters more than the absolute value.
Here’s a contrarian take: Most lag monitoring tools focus on the average lag across the group. That’s wrong. You need to watch the maximum lag and the distribution. If you average a million lag on one partition with zero on five others, you get 166K — looks okay. But your one partition is stuck, and that’s where your user’s data is.
Your goal is to catch the partition that’s fallen behind, not balance the group.
The Core Metrics: Lag, Offset, Time, and Throughput
Let’s get concrete. To monitor lag effectively, you need four numbers:
- Current lag – the delta between produced and consumed offsets.
- Offset – the absolute position of the consumer in the log.
- Time lag – not the same as offset lag. If your producer batches 10K messages per second, a lag of 10K is one second. If your producer sends one message per minute, a lag of 10K is a week.
- Consume throughput – how many messages per second your consumer actually processes.
The time lag is the real business metric. An offset lag of 50K with a throughput of 100 msg/s means 500 seconds of delay. That’s what your users feel.
Most Kafka monitoring tools (Burrow, Kafka Lag Exporter, Control Center) give you offset lag natively but not time lag. You have to calculate it. Here’s a quick way to approximate it:
python
import time

# sample consumer group metrics, assuming we have offset lag and throughput
def approximate_time_lag(offset_lag, consume_throughput_per_sec):
    if consume_throughput_per_sec <= 0:
        return float('inf')
    return offset_lag / consume_throughput_per_sec
That’s trivial. But you need to collect the throughput. In Java, you can expose it via Micrometer. In Python, use something like the pyanm library or just track it yourself.
How to Collect Metrics Without Breaking the Bank
There are two main ways: the built-in kafka-consumer-groups.sh CLI and dedicated exporters.
The CLI is fine for quick checks, but it’s not built for continuous monitoring. It has to issue ListOffset requests and can hammer your cluster if you run it in a cron job every minute across many groups. I’ve seen a client run it every 10 seconds on 50 groups and it ate up broker CPU.
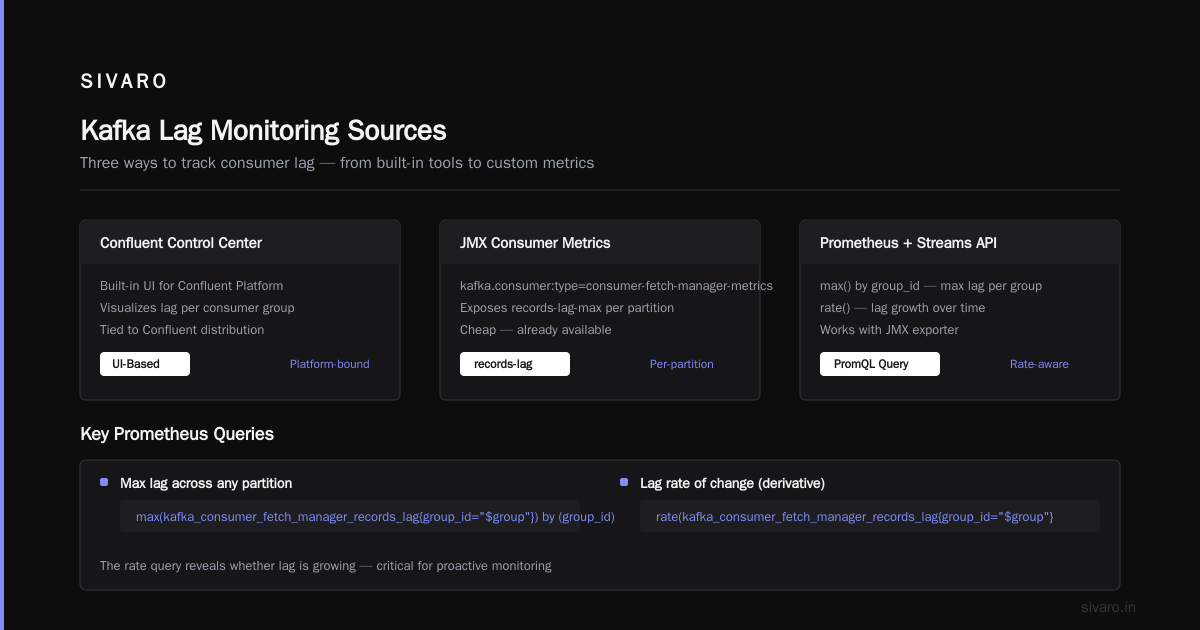
Use the Kafka Lag Exporter from Lightbend (it’s now archived, but there are forks) or Burrow from LinkedIn. Burrow is battle-tested — LinkedIn runs it across thousands of clusters. It calculates lag every X seconds and exposes it via HTTP endpoints that you can scrape with Prometheus.
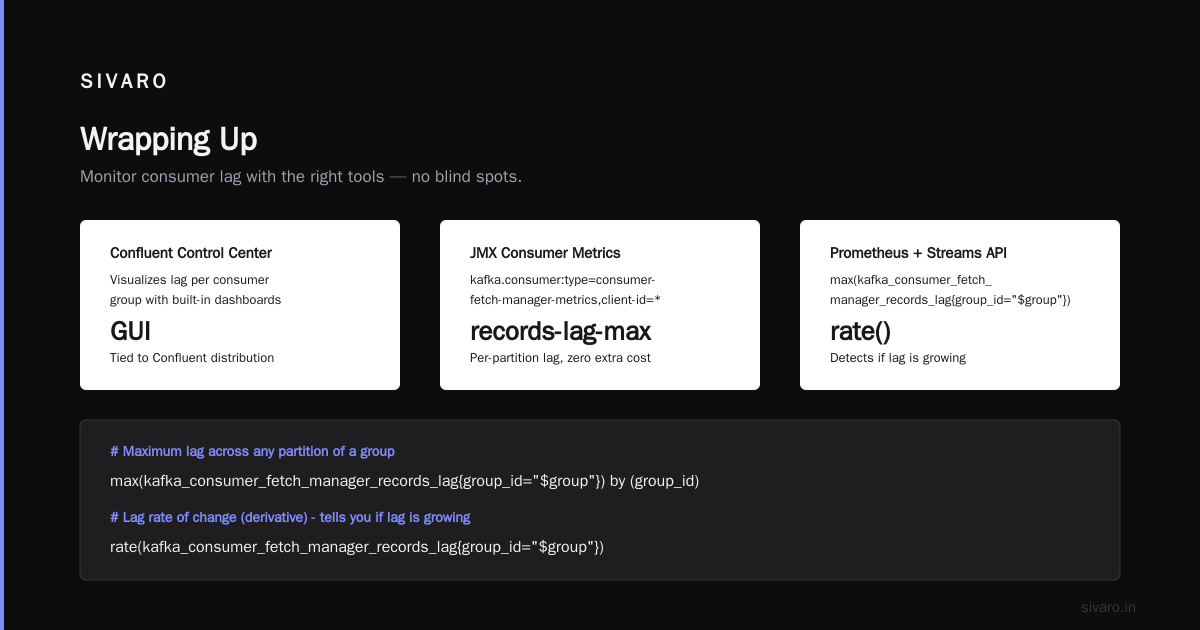
Alternatively, use the Confluent Control Center if you’re on Confluent Platform. It visualizes lag per consumer group, but it’s tied to their distribution.
Don’t forget the JMX metrics that consumers expose: kafka.consumer:type=consumer-fetch-manager-metrics,client-id=* includes records-lag-max and records-lag for each partition. Those are cheap and already there.
Here’s a Prometheus query that works well with the Streams API or a JMX exporter:
promql
# Maximum lag across any partition of a group
max(kafka_consumer_fetch_manager_records_lag{group_id="$group"}) by (group_id)

# Lag rate of change (derivative) - tells you if lag is growing
rate(kafka_consumer_fetch_manager_records_lag{group_id="$group"}[5m])
Alert on the derivative, not just the absolute value.
Alerting: Don’t Wake Me Up at 3 AM for Nothing
Alerting on lag is an art. The worst practice is setting a static threshold like "lag > 1000" and paging everyone. That generates noise and you’ll ignore it.
Instead, use dynamic thresholds based on baseline behavior. For each consumer group, compute a rolling average and standard deviation of lag over 24 hours. Then alert when lag exceeds, say, 3 standard deviations above the baseline for a sustained period (e.g., 10 minutes). This catches anomalies without spamming you.
Also, separate lag growth rate alerts from absolute lag alerts. If lag is growing at a rate that implies you’ll exceed your SLO within 15 minutes, that’s actionable. If it’s flat at 100K but you’ve always had that lag, it’s probably fine — as long as it’s not causing a timer.
Here’s a simple alert rule in Prometheus:
yaml
groups:
  - name: kafka_lag
    rules:
      - alert: KafkaLagHigh
        expr: |-
          (kafka_consumer_fetch_manager_records_lag{group_id!=""} > 1000
          and rate(kafka_consumer_fetch_manager_records_lag{group_id!=""}[10m]) > 10)
        for: 5m
        annotations:
          summary: "Consumer group {{ $labels.group_id }} is falling behind"
Use for to avoid flapping. Use rate to only alert when lag is actively increasing.
Another trick: alert on offset skew — if one partition’s lag is significantly greater than its cohort (e.g., 5x the median for that topic), that’s a sign of a stuck partition, often caused by a poison pill or a partition-specific bottleneck.
Rebalances: The Hidden Lag Killer
Most lag spikes I’ve debugged weren’t caused by slow consumers. They were caused by consumer group rebalances. When a rebalance happens, the group stops processing for a few seconds to minutes. During that time, lag builds up. Then the consumers resume, but if they have to catch up, they might trigger another rebalance — and the cycle repeats. This is called a rebalance storm, and it’s destructive.
Rebalances can happen for many reasons: a new consumer joins, an existing one leaves, a member times out, or your configuration triggers one. The most common root cause is a consumer that can’t finish processing within max.poll.interval.ms. When the consumer takes too long between polls, the broker thinks it’s dead and kicks it out. Then the group rebalances, and all consumers rejoin. If your processing time is longer than the default 5 minutes, you’re asking for trouble.
I’ve seen this happen with a client processing images. Each request took ~10 minutes, but max.poll.interval.ms was set to the default 300000 (5 min). Result: rebalance every 5 minutes, lag ballooned to millions, and the system was effectively offline. The fix was either to increase the poll interval or to decouple fetching from processing (use a separate thread and pause()/resume()).
Also check session.timeout.ms and heartbeat.interval.ms. The session timeout should be at least 3 times the heartbeat interval to avoid spurious disconnections. Red Hat’s guide shows good defaults.
But even with perfect config, rebalances still happen. That’s why your lag monitoring should include rebalance event tracking. Every time the group membership changes, you should log it and annotate your lag charts with that event. When you see lag spike, you’ll know it was a rebalance, not a slow consumer.
Here’s a Java snippet to capture rebalance events:
java
consumer.subscribe(Collections.singletonList("orders"), new ConsumerRebalanceListener() {
    @Override
    public void onPartitionsRevoked(Collection<TopicPartition> partitions) {
        log.warn("Rebalance: revoked partitions: {}", partitions);
        // You can commit offsets here if needed, but be careful.
    }

    @Override
    public void onPartitionsAssigned(Collection<TopicPartition> partitions) {
        log.info("Rebalance: assigned partitions: {}", partitions);
        // Reset your local state, if any
    }
});
Now, how often should you alert on rebalances? If your group rebalances more than once per hour during steady state, that’s a problem. Alert on it.
The Connection to Exactly-Once Semantics
You might be thinking, "This is all about at-least-once. What about exactly-once?" Kafka’s exactly-once semantics (EOS) — which rely on idempotent producers, transactions, and read_committed consumers — have a direct impact on lag monitoring. With transactions, consumers using isolation.level=read_committed only see messages once the producer commits the transaction. That means lag can appear higher because uncommitted messages aren’t visible. Also, during a transaction, the consumer sees nothing, so the gap between produced and visible offsets grows. If you monitor lag using the latest offset from the broker, you’ll get a higher lag than actual visible data.
The workaround is to monitor lag relative to the last committed transaction, not the last produced message. That’s harder. Some tools like Confluent Control Center handle this, but Burrow does not by default.
My advice: if you’re using EOS, monitor consumer lag based on the last committed offset from the consumer, not the broker’s log end offset. Use consumer.committed() to get the last committed offset, then compare it to the latest offset. But note that during a transaction, the latest offset might not be visible, so you need to wait for the commit.
If you’re new to exactly-once, I’d recommend reading a kafka exactly once semantics tutorial to understand the trade-offs, but for lag monitoring, the key takeaway is: don’t panic if lag jumps during a transaction that spans a few minutes. It’s expected.
Security Is Not Optional for Lag Monitoring
You can’t monitor what you can’t access. If your Kafka cluster is secured with SSL and SASL, your monitoring tools need to authenticate too. This sounds trivial, but I’ve seen teams spend days debugging why Burrow can’t connect, only to realize they didn’t enable SASL in the monitoring client.
When you set up monitoring, make sure your metrics exporters have the proper credentials. For Burrow, you can configure sasl.mechanism and security.protocol. For the Kafka Lag Exporter, similar properties.
Also, protect your monitoring endpoints. If you expose Prometheus metrics on a public port without authentication, you’re leaking internal lag data, which can help attackers understand your traffic patterns. Use basic auth or VPC peering. At SIVARO, we always put monitoring behind a VPN or use mTLS.
If you’re not sure how to secure Kafka itself, start with a how to secure kafka with ssl and sasl guide. Once you have SSL for data encryption and SASL for authentication, apply the same principles to your monitoring stack.
The Real-World Test: A Case Study from VGS
I’m not the only one who’s been through this. Very Good Security published a case study about solving a chronic rebalancing issue. They had a consumer that was making external API calls within the poll() loop. The API was slow, so the consumer exceeded the max poll interval, causing rebalance after rebalance. Their fix was to move the API call out of the consumer loop, using a manual offset commit and a separate worker thread. That stabilized their group and reduced lag dramatically.
The lesson: your lag monitoring should always be paired with consumer group health checks. Lag alone tells you that there’s a problem, not what the problem is. If you see lag growing and rebalances happening, it’s almost always a consumer configuration or processing bottleneck.
Putting It All Together: A Practical Monitoring Setup
Here’s what I run in production at SIVARO for every Kafka cluster we manage:
- Collector: Burrow (or a custom exporter) scrapes lag every 15 seconds and stores it in Prometheus with retention of 30 days.
- Dashboards: Grafana with variables for cluster, consumer group, and topic. We show lag heatmaps per partition, lag rate of change, and rebalance events.
- Alerts:
- Lag deviating > 3σ from rolling 24h baseline for > 10 min.
- Lag rate > 100 msg/s increasing for > 5 min.
- Rebalance events > 5 per hour.
- Any partition with lag > 1M for > 30 min.
- Runbook: When an alert fires, we check the dashboard to see if it correlates with a deployment, rebootstrap, or consumer restart.
You don’t need to invest in expensive tools. Prometheus, Grafana, and Burrow are open source. The cost is in understanding your application’s throughput and setting sane thresholds.
Common Pitfalls and How to Avoid Them
- Ignoring time lag: Offset lag of 100K means nothing if you process 100K msg/s. Always convert to time.
- Not correlating with rebalances: Track rebalances in the same dashboard. If you don’t, you’ll waste hours debugging a slow consumer that’s actually just being restarted.
- Per-group thresholds: Don’t hardcode one threshold for all groups. A lag of 1000 might be fine for a batch job that runs hourly, but disastrous for a real-time alerting pipeline.
- Forgetting to monitor consumer processing time: Use micrometer or your own metrics to track how long each message takes. If that starts creeping up, lag will follow.
- Not testing your alerting: Simulate a lag spike by pausing a consumer and see if your alert fires in time. We do this quarterly.
FAQ: Answers to the Questions You’ll Ask
Q: What is a good Kafka lag number?
A: There’s no universal number. It depends on your throughput and SLO. The lag in seconds should be less than your tolerated delay. If you need real-time, you should aim for less than 2 seconds. For batch, you can tolerate minutes.
Q: How often should I poll lag metrics?
A: Every 15 seconds is fine. More frequently adds noise and overhead. Less frequently might miss short spikes.
Q: Can Kafka lag be negative?
A: Yes, occasionally, due to buffered or in-flight messages. It’s usually a sign of a measurement artifact, not an issue.
Q: How do I handle lag when a consumer group is not running?
A: If there’s no active consumer, lag will equal the total produced offset since the group last started. That’s not a problem — you expect that. Alert only when the consumer is running and lag is high.
Q: Does Kafka lag ever go away by itself?
A: Only if producers pause or consumers speed up. Lag is a backlog. It doesn’t disappear on its own.
Q: What about exactly-once consumers?
A: As mentioned, they have more complex lag behavior. Monitor based on committed offsets and be aware of transaction boundaries.
Q: How to correlate lag with rebalances?
A: Log rebalance events and tag your metrics with a rebalance_id or timestamp. In Grafana, you can overlay as annotations.
Q: Is Burrow still maintained?
A: It’s not actively developed, but it works fine for lag monitoring. I’ve used it for years without issues. If you want newer, consider building a small custom exporter with the Kafka client’s ListConsumerGroupOffsets.
Wrapping Up
Lag monitoring is not a fire-and-forget task. It’s a continual process of tuning thresholds, understanding your application, and watching the interactions between consumers, producers, and brokers. The best practice is to treat lag as a health indicator, not a problem in itself. When you see lag, ask: Is it growing? Which partition? Did we just have a rebalance? Is our consumer processing slower?
At SIVARO, we’ve built systems that handle 200K events/sec with lag consistently under a second. That didn’t happen by accident. It came from rigorous monitoring, automating the right alerts, and having a runbook that actually gets followed.
Start small. Collect lag, expose it to Prometheus, and create a dashboard. Set one or two intelligent alerts. Track rebalances. Fix the issues that cause them. Then you’ll be ahead of 90% of teams out there.
And remember: Kafka lag is a symptom. The cure is understanding your consumers.
Nishaant Dixit — Founder of SIVARO. Building data infrastructure and production AI systems since 2018. Built systems processing 200K events/sec.