 SIVARO
Kafka Lag Monitoring: The Metric That Actually Matters
I've spent eight years building data infrastructure, and I'm still surprised by how many teams treat Kafka lag like a check-engine light. They see it flash, panic, and restart everything.
That's not monitoring. That's superstition.
Here's the truth: most Kafka performance problems are invisible if you only watch lag. And many lag problems are actually consumer problems, not Kafka problems. The distinction matters, and I'll show you how to tell them apart.
This guide covers how to monitor kafka lag and performance — what to watch, what's noise, and what to do when things break. I'll show you what I've learned running systems that process 200K events per second, including the failures that taught me the most.
What Lag Actually Tells You
Kafka lag is the distance between the last message written to a partition and the last message your consumer processed. Simple concept. Deceptively complex in practice.
If lag grows, messages wait longer to be processed. If lag grows forever, consumers eventually fall so far behind that they're processing yesterday's business (or last week's).
But lag alone doesn't tell you why it's growing. It doesn't tell you whether your consumer is slow, your producer is flooding the system, or a truly evil rebalance just kicked in.
Think of lag as a symptom, not a diagnosis. When a patient has a fever, you don't just prescribe ice. You investigate.

The Kafka consumer group rebalance explained materials are worth reading, but I'll give you the short version: rebalances are when your consumer group reshuffles partition assignments. They're normal and necessary — until they happen too often or take too long. That's where the term "rebalance storm" comes from. And it's exactly where most lag problems originate.
The Consumer Group State: Where Everything Goes Wrong
Consumer groups are Kafka's way of distributing work. Each group has members (consumers) that own partitions. The group coordinator — that's the broker — tracks membership and assignment.
Here's where it gets ugly. When a consumer joins or leaves a group, the coordinator triggers a rebalance. During a rebalance, everyone in the group pauses. They stop consuming. They revoke their partitions. Then they get new assignments and start again.
Kafka Rebalancing Explained: How It Works & Why It Matters from Confluent does a solid job breaking down the protocol. The key insight: rebalances aren't free. They stop the world (your consumer group's world). If they happen frequently, lag spikes.
At my company SIVARO, we saw a client in 2024 whose rebalances were happening every 90 seconds. Their lag was growing by millions of messages per hour. The culprit wasn't a slow consumer — it was a misconfigured heartbeat interval and a consumer that was doing too much work between polls. Every time the consumer got stuck processing, the broker thought it died and triggered a rebalance. Death spiral.
The Redpanda guide on rebalancing triggers nails the root causes — and it's a good place to start regardless of whether you're running Kafka or Redpanda. The trigger patterns are universal.
The Protocol Change That Rewrote the Rules
Before Kafka 2.4, all rebalances were "eager" — every consumer released all partitions, then they got reassigned. That meant total downtime during every rebalance. In high-volume systems, that's catastrophic.
Kafka 2.4 introduced incremental cooperative rebalancing, which was a genuine game-changer. Consumers only release partitions they actually need to give up, and they keep consuming everything else during the rebalance.
The problem? It only works if your client library supports it. Older clients default to eager rebalancing, which means your "upgraded" Kafka gets old-school behavior. That disconnect explains a lot of the "we upgraded and now lag is worse" stories I've heard.
If you're still running eager rebalancing in 2026, you're leaving performance on the table. Not a little. A lot.
How to Monitor Kafka Lag and Performance: Start With These
Building the right observability stack isn't necessarily about tools — it's about knowing what to look for. Here's what I watch, in priority order.
1. Consumer Group State and Partition Lag
The kafka-consumer-groups CLI is your first tool. It's ugly, but it works.
bash
kafka-consumer-groups.sh   --bootstrap-server broker1:9092   --describe   --group my-consumer-group
This shows you:
- Current offset
- Log-end offset
- Lag per partition
I run this in a loop with watch when something looks wrong. It takes 30 seconds to see patterns that dashboards won't show for minutes (if they show them at all).
Of course, this only works for consumers using the Java client or libraries that implement the Kafka protocol correctly. Anyone running raw assignment in Python, like I did in 2019 with my first Kafka project, doesn't get this for free. You have to instrument manually.
2. Automated Lag Tracking via JMX
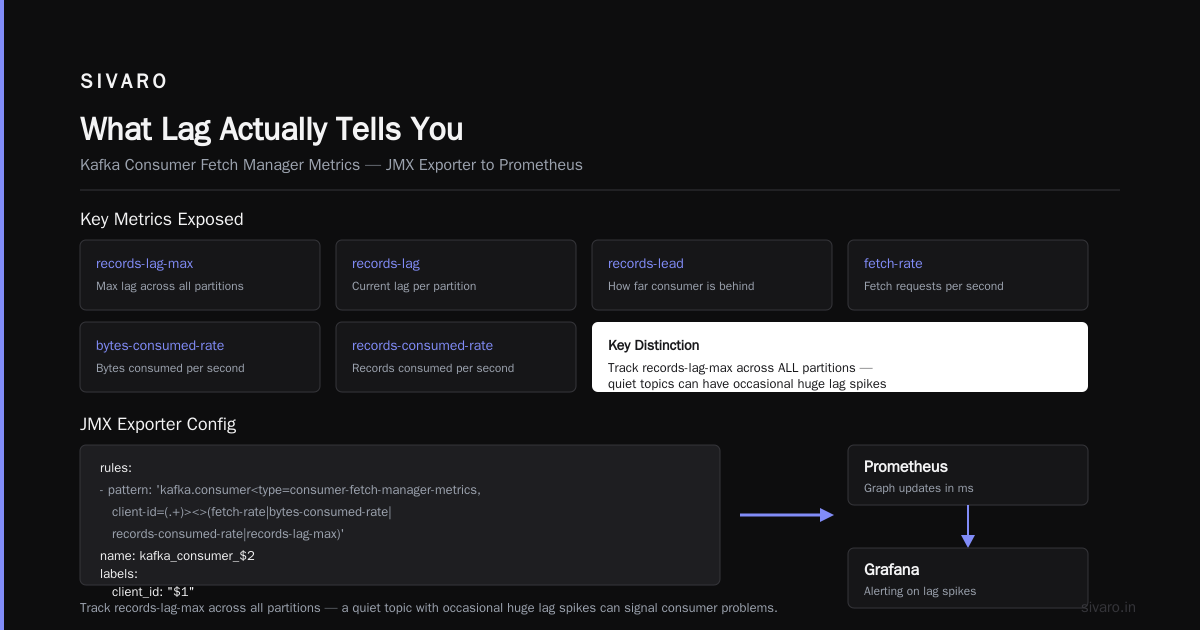
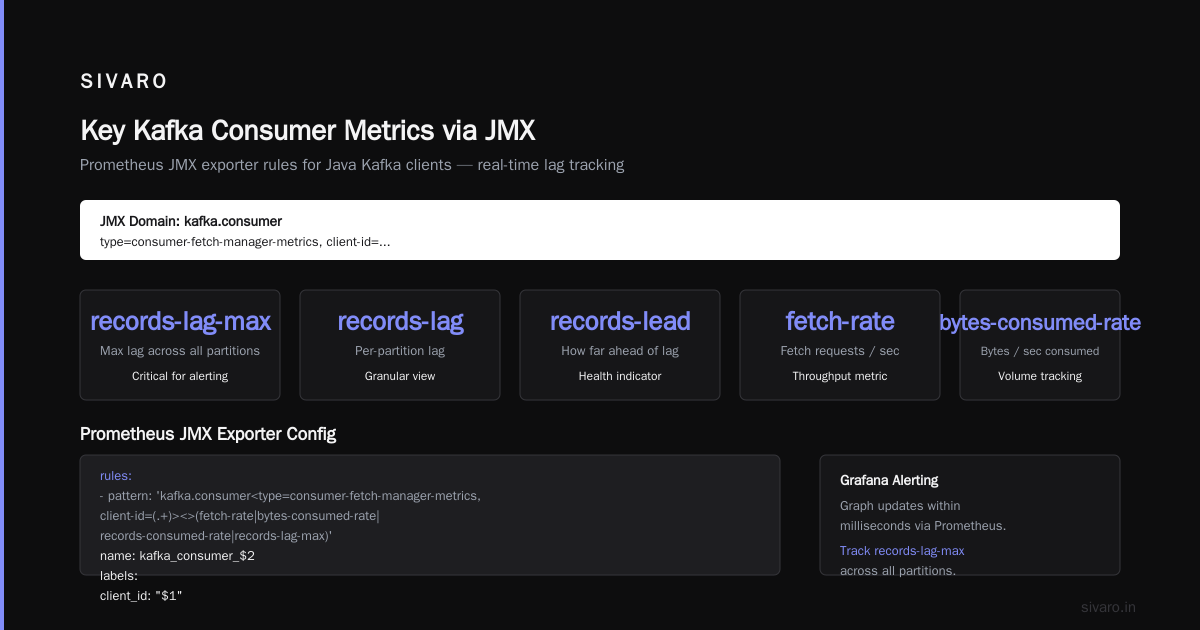
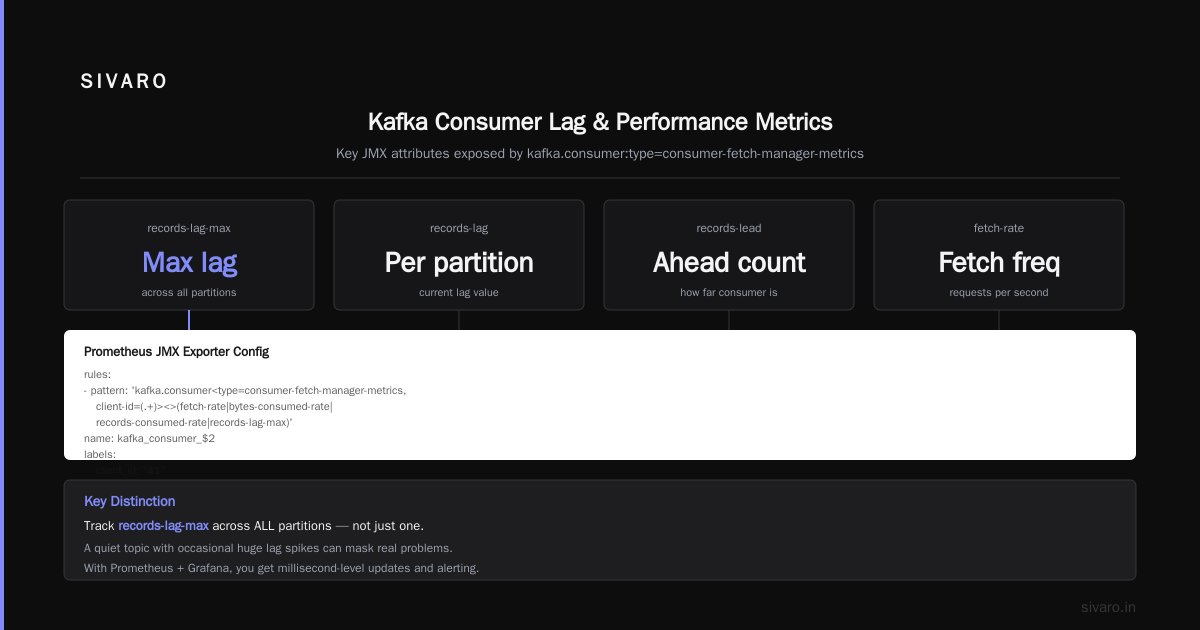
The most pragmatic monitoring I've done is placing JMX metric collection in front of the consumer. Kafka's Java clients expose kafka.consumer:type=consumer-fetch-manager-metrics,client-id=... attributes, including:
java
records-lag-max
records-lag
records-lead
fetch-rate
bytes-consumed-rate
records-consumed-rate
Here's an example Prometheus JMX exporter config that captures what matters for a Java Kafka client:
yaml
rules:
  - pattern: 'kafka.consumer<type=consumer-fetch-manager-metrics, client-id=(.+)><>(fetch-rate|bytes-consumed-rate|records-consumed-rate|records-lag-max)'
    name: kafka_consumer_$2
    labels:
      client_id: "$1"
Using Prometheus, you get a graph that updates within milliseconds. And you can use this with Grafana for alerting.
The key distinction: track records-lag-max across all partitions. A quiet topic with occasional huge lag spikes can look fine at the average level but be very broken in detail.
3. Writing Your Own Lag Checker
Want to know how to monitor kafka lag and performance without adding vendor dependencies? Here's a minimal approach in Python:
python
from confluent_kafka.admin import AdminClient, ConsumerGroupDescription

admin = AdminClient({
    "bootstrap.servers": "broker1:9092"
})

groups = admin.list_consumer_groups()
for group in groups.result():
    try:
        desc = admin.describe_consumer_groups([group.group_id])
        for gid, result in desc.items():
            if result.result():
                print(f"Group {gid}:")
                for member in result.result().members:
                    for assignment in member.assignment.partitions:
                        print(f"  - Partition {assignment.partition}: lag unknown (requires offset API)")
            else:
                print(f"Group {gid}: {result.exception()}")
    except Exception as e:
        print(f"Group {group.group_id}: {e}")
This only gives you group information, not actual lag numbers. The offset API is the critical piece. In production, I built a lag monitor that pulls:
offsets_for_times(timestamp=now - 60s)for the log-end offsets- stored consumer offsets via
list_consumer_group_offsets()
Then, it computes lag = (log-end offset at current time) – (committed offset).
This works for both Java and non-Java consumers. It also reveals something crucial about consumer health: when lag isn't changing, it isn't necessarily a good sign.
4. Kafka Exporter and Metrics in Cloud
If you run Kafka on Amazon MSK or Confluent Cloud, you often get a built-in metrics API. The open-source Kafka exporter is useful, especially for broker metrics like kafka_broker_leadership and kafka_controller_offline_partitions.
But I'll be blunt — a lot of teams go overboard on broker metrics. Memory, CPU, disk I/O — sure, watch them. But the real problem is usually consumer-side. See, Kafka is designed to "absorb" consumer-side slowness into broker log retention. Your broker can look perfect while your consumer lags by hours.
5. Alerting on Consumer Group State
No article on monitoring is complete without addressing alerts.
I've been telling teams to alert on lag slope rather than raw lag. A lag spike that returns to zero in one minute is noise. A lag that grows steadily at 1,000 messages per second for three minutes is a you problem.
Here's a practical Prometheus alert rule:
yaml
groups:
  - name: kafka-lag-alerts
    rules:
      - alert: KafkaLagGrowth
        expr: |
          avg(
            delta(
              kafka_consumergroup_lag{
                consumer_group!~"infra|reserved"
              }[5m]
            )
          ) > 500
        for: 5m
        annotations:
          summary: "Consumer group {{ $labels.consumer_group }} is falling behind"
This only triggers if lag grows by 500 messages per 5 minutes. Noticably slower processing, but not an instant spike that might resolve itself.
Rebalancing Hygiene: The Most Ignored Factor
Let me be direct about this. Teams spend enormous effort tuning brokers and almost no effort tuning consumer group rebalances. That's backwards.
A 10,000-messages-per-second consumer that rebalances twice an hour is fine. A 10,000-messages-per-second consumer that rebalances twice a minute is catastrophic. The consumer never gets enough stable time to process.
The verygoodsecurity.com case study describes a real incident at VGS, a payments security company. Their e-commerce platform's pipeline slowed to a crawl because of rebalancing storms. The fix involved:
- Increasing
session.timeout.ms(from 10s to 30s). This prevented false positives on consumer death. - Increasing
max.poll.interval.ms(from 5 minutes to 10 minutes). The consumers were occasionally taking longer to process because of downstream API latency. - Setting
partition.assignment.strategytoCooperativeStickyAssignorexplicitly (instead of leaving the default). - Ensuring consumers didn't execute an urgent synchronous call during
poll()processing.
This improved the consumer group's stability from roughly 15 minutes between rebalances to several hours.
The lesson this case study drives home: tuning your lag monitor is only one side of the coin. You also need to prevent the lag by tuning the rebalance behavior.
Consumer-side Performance Traps
If you're asking how to monitor kafka lag and performance and you've conquered the rebalance side, the next frontier is consumer code.
Here are the three most common consumer killers I've seen in production:
1. Blocking Operations Inside the Poll Loop
Every time you call poll(), you're making a promise to the broker: you'll process everything in the last batch within max.poll.interval.ms. If you don't, the broker assumes you died and kicks you out of the group.
Let me tell you — the number of teams I've met that put a database call inside the poll loop without thinking twice is staggering.
The fix is to separate the poll loop from the processing loop. Here's the pattern I use:
java
while (running) {
    ConsumerRecords<String, String> records = consumer.poll(Duration.ofMillis(1000));
    if (!records.isEmpty()) {
        // Submit to a thread pool or async processor
        processAsync(records);
    }
    // Commit offsets at a controlled rate here
    consumer.commitAsync();
}
This decouples consumption from work. If the processing takes 10 seconds, the consumer doesn't block — but you need to be careful with manual offset commits.
2. Offsets Are Committed Too Infrequently
I saw one customer who committed offsets once per minute. If they crashed, they reprocessed 60 seconds of messages. That's 60 seconds of duplicate work. And if their downstream system wasn't idempotent, it meant corrupted data.
Kafka exactly once semantics example cases exist, but they come with a performance overhead. Yes, Kafka's exactly-once semantics exist, and yes, they're great for accounting systems. But they're not free. In a high-throughput telemetry pipeline, I'd choose at-least-once with idempotent downstream writes over Kafka's EOS. Accept the occasional duplicate, deduplicate idempotently, and save the CPU.
3. The "Bratty" Consumer Pausing Partitions
Some consumers pause fetching when they detect a downstream issue. That's literally what consumer.pause(partition) does in Java. It seems like a good idea — backpressure!
But here's the trap: a paused partition's lag grows without bound. And many monitoring tools report "consumer is alive" even while it's paused, because the consumer is still polling, just not fetching.
When you're building your alerting, account for paused partitions — if your consumer pauses for legitimate backpressure, you want the alert to reflect a "backpressure event" and not a "consumer failure."
What to Instrument for Long-term Performance
The biggest difference between mediocre and great data teams is how they handle long-term analysis. One-time debugging gets you nowhere if you can't compare this month's lag pattern to last month's.
Set up 90-day retention for key metrics:
- Lag per consumer group, per partition (at, say, 60-second granularity)
- Consumer group size and membership changes (rebalance count per hour)
- Consumer processing rate (messages per second per partition)
- Consumer poll-to-process latency
Tools like Burrow (LinkedIn's lag checker), or a custom tool using Kafka's metrics API, work well. I've built small utilities using kafka.tools internals that emit group data to Prometheus.
The Single Most Important Diagnostic: Does Your Lag Slope Change with Throughput?
One of the most effective questions I ask when diagnosing a lag issue is: "What were the input and output rates when it started?"
Take a consumer group that processes 10K msg/s and has 100K lag. It's growing. Is the producer sending 12K msg/s and the consumer only processing 9K? Or did the input spike to 100K msg/s and the consumer is overwhelmed, even though it's processing at its usual 10K msg/s?
These are different problems:
- If consumer rate is lower than producer rate → your consumer is undersized or slow. Tune the consumer.
- If producer rate surged → you may need to scale out the group — add more consumers, but stay within partition counts.
- If producer and consumer rates are equal, but lag persists → check for duplicate processing, serialization bugs, or offset commit storms.
I use these rough thresholds:
| Condition | Action |
|---|---|
| Lag > 100K, trend flat | Healthy — backend is keeping up |
| Lag > 100K, trend upward | Investigate consumer or scale out |
| Lag > 1M, upward | Critical — likely a rebalance storm or stuck consumer |
| Lag = 0 | Could still be bad. If you aren't consuming fast enough to catch spikes, you're just fine. But if the topic is dormant, 0 is "nothing to process," not "we're amazing." |
Coaching Against the Alert Fatigue Trap
I want to close the monitoring part with a less technical, more operational piece of advice.
For every metric you add, ask: "If this fires, what do I do?"
If the answer is "Nothing, we'll look at it" — remove the metric. Alerting on lag alone creates alert fatigue. And alert fatigue is how your genuinely emergency lag growth alert gets ignored during a real incident.
The metric that matters is lag growth rate (dLag/dt), not lag itself.
- If lag is growing at 100 msg/s and it's 8pm on a Tuesday, you can spend 20 minutes investigating.
- If lag is growing at 100K msg/s and it's 3am on a Sunday, you wake the on-call engineer yesterday.
Factor time-of-day and business-criticality into your alert routing.
Monitoring Best Practices for Kafka: A Checklist
Here's my in-field checklist. This is the result of every Kafka incident I've been through, including the one where I spent a weekend debugging a consumer that kept dying because of a firewall rule that only applied to one region.
- [ ] Track lag per partition, not just per group. Lag on one partition is a hot-spotting problem.
- [ ] Track consumer group size and rebalance count hourly. Sudden rebalance spikes correlate with lag spikes.
- [ ] Track consumer processing time per records batch. If this grows, it's a code problem.
- [ ] Track consumer poll-to-commit latency. Long gaps between poll and commit are a sign of a badly designed processing path.
- [ ] Set alerts on lag slope, not lag value.
- [ ] Correlate lag spikes with deployment times. Often, new code causes the problem — the "new release broke Kafka" effect.
- [ ] Monitor the end of the topic, not just the consumer. If the topic's retention is exceeded, you'll lose messages before lag ever registers.
One more thing: if you use exactly-once semantics, monitor the transaction time and the producer's transaction.timeout.ms thoroughly. Transactions can block consumers when the transaction coordinator is slow.
What Happens When You Ignore This (A War Story)
- A large payments company. 50+ microservices, all connected via Kafka. I'm called in because their order processing lag exceeds 2 hours during peak traffic.
We looked at the lag graph. The lag curve wasn't smooth — it had jagged steps. A smooth upward curve suggests a slow consumer. A jagged step pattern looked like a consumer dying and restarting.
Checking the consumer group's metadata, we found rebalances every 4-6 minutes. The max.poll.interval.ms was the default (5 minutes), but the consumer's processing time per batch had grown to 8-10 minutes because of a newly-added synchronous downstream API call. The consumer silently exceeded max.poll, got kicked out, rejoined, repeated.
The fix took 2 hours: tune the consumer to run the processing asynchronously, decouple the poll from the work, and increase the interval as a safety net.
They went from 2-hour lag at peak to ~2-second lag. The monitoring was normal the whole time — that's the part that scared me.
Frequently Asked Questions
Q: How often should I check Kafka consumer lag?
Real-time monitoring via Prometheus (or Burrow) is ideal. If you're running a manual check, run it every 60 seconds for a glimpse. For production alerting, I check it every 15 seconds.
Q: What is the best tool for Kafka lag monitoring?
Burrow, Kafka's own admin tool, Datadog's Kafka integration, Confluent Control Center — all work. My choice is custom metrics into Prometheus. It's portable, and you own the alerting logic.
Q: Can I monitor Kafka lag without adding tools?
Yes. The kafka-consumer-groups.sh --describe CLI is a reliable starting point for manual checks. For repeated monitoring, use cron to dump this to a log file.
Q: How can I tell if my Kafka consumer is slow or if Kafka is slow?
Pull broker-side metrics: produce throughput, fetch throughput, request queue time. If the broker is healthy (no network bottlenecks), the consumer is usually the problem.
Q: Is a consumer group with high lag always unhealthy?
No. If your business accepts a one-minute delay in order updates, then 60 seconds of lag is fine. If lag is steadily growing, that's the tell. "Lag + trend + business SLA" = the correct alert scope.
Q: Should I use Kafka's exactly-once semantics for every use case?
No. The overhead of exactly-once is real. Use it for financial transactions, not for analytics logs.
Knowing How to Monitor Kafka Lag and Performance Is About Knowing Your End-to-End Pipeline
Here's my final piece of advice.
You can instrument every single Kafka metric, buy the most expensive monitoring product, and still miss the real issues. Because real Kafka issues are often end-to-end issues. The producer floods a topic with bad data. The consumer's downstream dependency (a database, a REST API) slows down. The consumer's lag grows, but the root cause isn't in Kafka.
Learn to trace from producer through Kafka to consumer. Know your end-to-end throughput. That's what "how to monitor kafka lag and performance" actually means — not just observing Kafka in isolation, but understanding the system it serves.
Related Reading:
- Kafka Rebalancing Explained: How It Works & Why It Matters
- Kafka Rebalancing: Triggers, Effects, and Mitigation
- How to Handle Rebalancing in Kafka Consumer Groups
- Solving Kafka Rebalancing Issues: A Case Study
- Everything You Always Wanted to Know About Kafka's Rebalance Protocol (SlideShare)
- How to avoid rebalances and disconnections in Kafka consumers
Nishaant Dixit — Founder of SIVARO. Building data infrastructure and production AI systems since 2018. Built systems processing 200K events/sec.