 SIVARO
Kubernetes Cost Monitoring Karpenter Dashboards: A Practitioner's Guide for 2026
I walked into a war room at 3 AM last February. Our Karpenter cluster was spinning up instances like it was going out of style. The bill hit $127,000 in a single week. The dashboard said we were saving money. It was lying.
That's the problem with kubernetes cost monitoring karpenter dashboards in 2026. Most of them show you what's easy to measure, not what matters. They tell you node utilization is great. They don't tell you that your GPU instance with 8 vCPUs is 90% idle because your inference workloads are memory-bound, not compute-bound.
I'm Nishaant Dixit. My team at SIVARO builds data infrastructure for companies processing 200K+ events per second. We run Kubernetes clusters across AWS, GCP, and Azure. And we've spent the last 18 months obsessing over one question: how do you build dashboards that actually help you control Karpenter costs instead of just reporting them?
This guide is what we learned.
Why Most Karpenter Cost Dashboards Lie to You
Here's the dirty secret about kubernetes cost monitoring tools karpenter ecosystems in 2026: most of them measure allocation, not cost.
Your average dashboard shows CPU and memory utilization per namespace. It divides the total cluster bill by usage. It calls that "cost allocation."
But Karpenter doesn't provision nodes based on namespace averages. It provisions based on pod scheduling decisions that happen in milliseconds. Those decisions are driven by constraints, taints, topology spread, and instance availability. You're measuring averages against a system that operates on individual pods.
That mismatch is where the money leaks.
At SIVARO, we had a client running a batch processing pipeline. Their Karpenter dashboard showed 65% average node utilization. Looked fine. But when we built per-instance cost dashboards, we found eight r5.8xlarge instances running for 12 hours with zero compute load. They had a memory leak in their processing code. The pods requested 64GB each, Karpenter provisioned the right nodes, and the dashboard reported high "utilization" because the memory was allocated.
Karpenter did its job perfectly. The dashboard was technically correct. The cost was catastrophic.
The lesson: kubernetes cost monitoring karpenter dashboards need to track marginal cost per scheduling decision, not cluster-level averages. You need to know: "When Karpenter chose an m6i.2xlarge over an m6i.large, how much did that decision cost?"
The Three Signals You Actually Need to Monitor
Most people think you need ten dashboards. You don't. After hundreds of cluster reviews, I've narrowed it to three signals.
Signal 1: Provisioning Efficiency
This is the ratio of requested resources to provisioned resources for every Karpenter decision. Karpenter bins pods into instance types based on requirements. If your pods request 8 CPUs and 32GB of memory, and Karpenter provisions an instance with 8 CPUs and 64GB, that binning waste shows up here.
Track this per-node your initialization uses.
yaml
# Prometheus recording rule for provisioning efficiency
- record: karpenter:provisioning_efficiency:ratio
  expr: |
    sum by (node, instance_type) (
      kube_pod_resource_request{resource="cpu"}
      * on(pod, namespace) group_left(node) kube_pod_info
    )
    / on(node) group_right()
    karpenter_node_allocatable{resource="cpu"}
A ratio below 0.6 means you're leaving money on the table. We saw one client running at 0.35. They were provisioning 100 cores to get 35 cores of work done.
Signal 2: Instance Type Cost Correlation
This one's simple. Build a heatmap of instance types by cost per pod scheduled. Karpenter picks instances based on availability and price. But "available" and "cheap" aren't always the same thing.
promql
# Cost per pod by instance type over last 30 days
sum by (instance_type, provisioner_name) (
  karpenter_cloudprovider_instance_type_price_estimate
  * on(instance_type) group_left()
  count by (instance_type) (karpenter_pod_scheduling_e2e_seconds)
)
A 2025 study found that diversified EC2 usage reduced costs by 28% compared to single-instance-type strategies Kubernetes Cost Optimization: A 2026 Guide to Reducing.... But that data's only useful if your dashboard makes the tradeoff visible. Does tolerating spot interruptions for a 40% discount justify the retry overhead on your batch jobs? The dashboard should tell you.
Signal 3: Right-sizing Gap
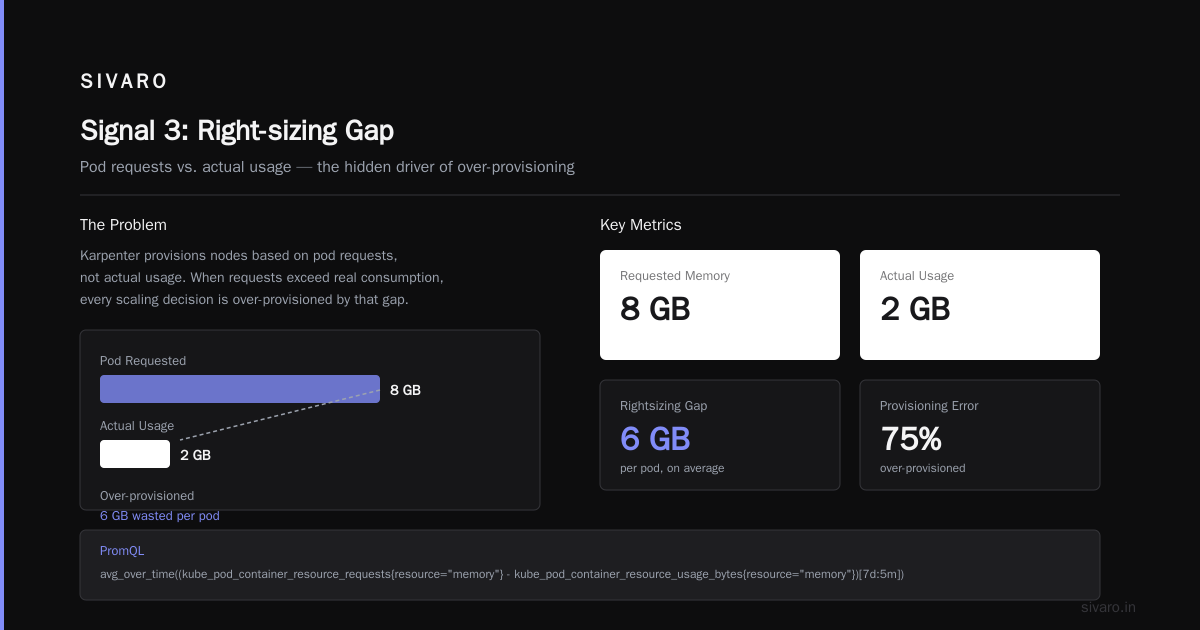
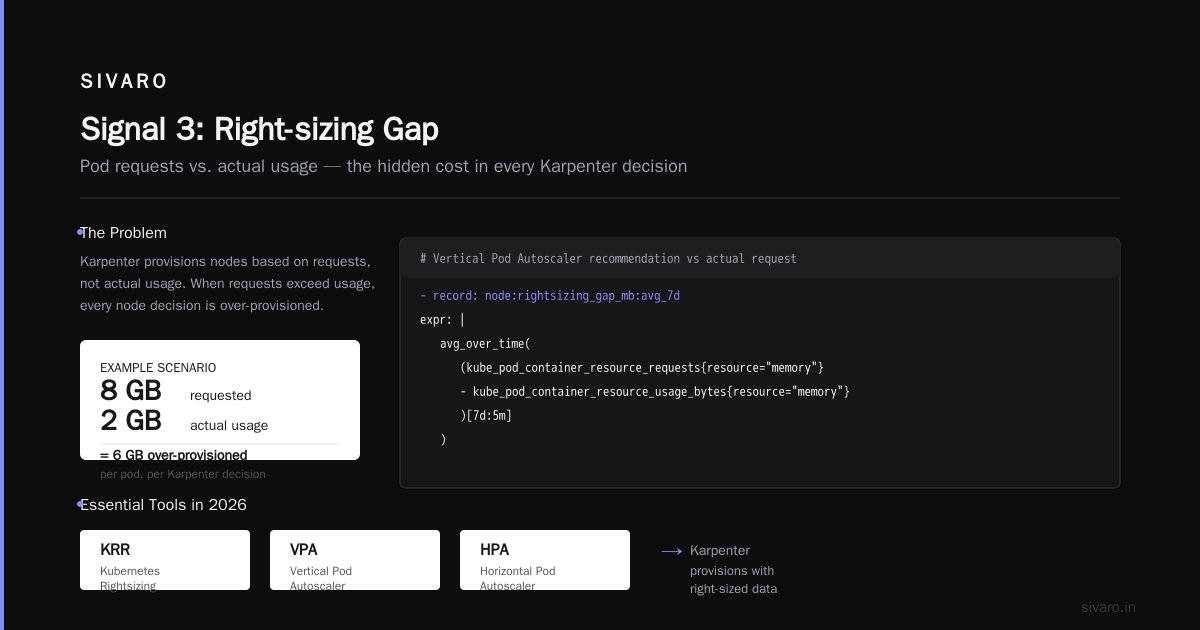
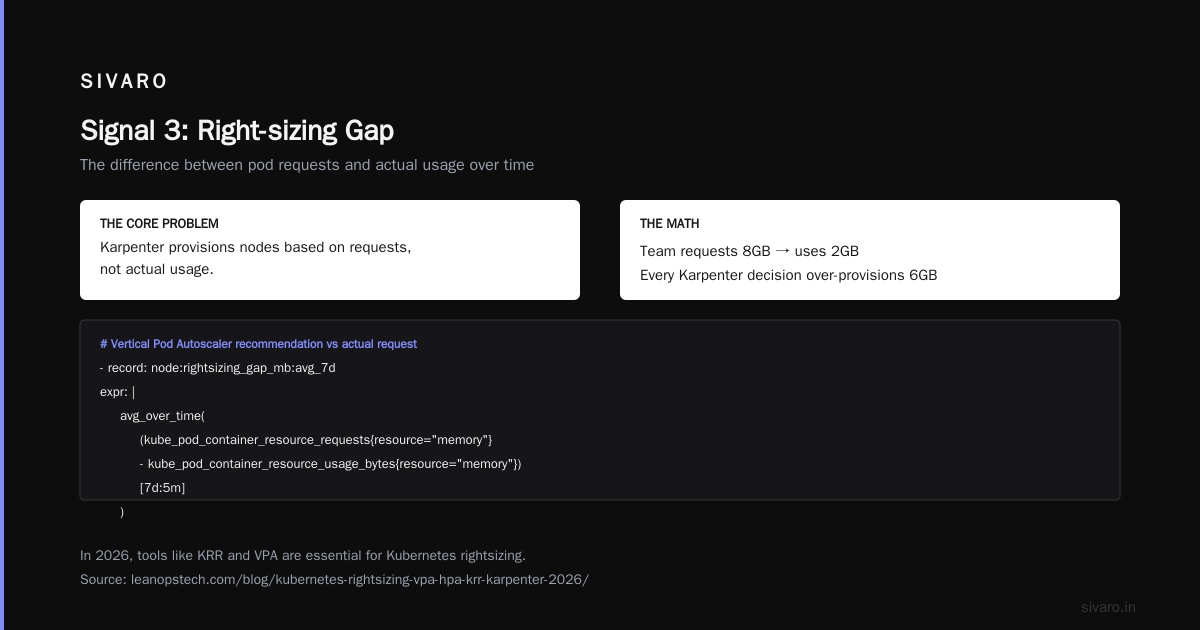
This is the difference between pod requests and actual usage over time. Karpenter provisions nodes based on requests, not usage. If your team requests 8GB and uses 2GB, every Karpenter decision is over-provisioned by 6GB.
yaml
# Vertical Pod Autoscaler recommendation vs actual request
- record: node:rightsizing_gap_mb:avg_7d
  expr: |
    avg_over_time(
      (kube_pod_container_resource_requests{resource="memory"}
      - kube_pod_container_resource_usage_bytes{resource="memory"}
      )[7d:5m]
    )
In 2026, tools like KRR and VPA are essential for this Kubernetes Rightsizing in 2026: Why VPA, HPA, KRR, and.... But most organizations don't surface this data on their cost dashboards. They should.
Building Your Own Kubernetes Cost Monitoring Karpenter Dashboards
Here's how we build them at SIVARO. I'll walk through the stack and the design choices.
Step 1: Instrument Karpenter Properly
Karpenter exposes metrics through Prometheus. But the default metric set isn't enough. You need to enable the cloud provider metrics that track instance pricing.
yaml
# Karpenter values.yaml for cost-optimized monitoring
controller:
  env:
    - name: METRICS_ENABLED
      value: "true"
    - name: METRICS_ENDPOINT
      value: "0.0.0.0:8000"
    - name: CLOUD_PROVIDER_METRICS
      value: "instanceTypes,priceEstimates"
    - name: SPOT_INSTANCE_ENABLED
      value: "true"
Without priceEstimates, your dashboards can't correlate instance types with cost. We learned this the hard way after two months of dashboards that showed utilization but didn't explain why our bill was climbing.
Step 2: Build the Cost Attribution Model
This is the hard part. You need to map every Karpenter-provisioned node to the workloads that triggered it, the time it was active, and the price paid.
We use a combination of:
karpenter_node_created_secondstimestampskube_pod_infofor pod-to-node mapping- Cloud provider billing data (AWS CUR, GCP billing export)
- A custom enrichment layer that joins these on
node_id
The result is a table like this:
node_id | provisioner | instance_type | price_per_hour | active_seconds | pod_count | namespace | cost
Without this table, your dashboards are just pretty graphs. With it, you can answer questions like "What did namespace X cost in provisioning inefficiency last week?"
Step 3: Design the Actual Dashboards
We use Grafana. Here are the three panels that matter most.
Panel 1: Provisioning Waste Over Time
This is a stacked area chart showing:
- Cost of bin packing waste (provisioned but not requested)
- Cost of over-provisioned requests (requested but not used)
- Cost of actual workload execution
You'll see that in most clusters, 15-30% of spend falls into the first two categories Top 18 Kubernetes Cost Optimization Strategies in 2026.
Panel 2: Instance Type Distribution with Cost Overlay
A Sankey diagram from instance type to namespace, colored by cost efficiency. Green means the namespace's requests match the instance's capacity well. Red means they don't.
Panel 3: Spot Interruption Cost Impact
Shows how often spot instances are reclaimed, what workloads get evicted, and the compute time lost. If your retry overhead exceeds the spot discount, you should switch to on-demand.
The Tooling Landscape in 2026
I've tested most of the major players. Here's my honest take.
Kubecost is still the most mature. Their Karpenter integration is decent, but their cost allocation model assumes stable pricing. In 2026, with GPU spot prices fluctuating 300%+ intra-day, that assumption breaks Cast AI vs ScaleOps vs StormForge vs Kubecost.
Cast AI does real-time cost optimization better than anyone. Their Karpenter-native approach shows costs at the pod scheduling level. We've seen 40% reductions in some clusters. But their pricing model is expensive for large clusters (500+ nodes).
ScaleOps surprised me. Their 2026 release added Karpenter-specific dashboards that track exactly the three signals I mentioned. The automatic right-sizing feature works well for stateless workloads Kubernetes Cost Optimization: A 2026 Guide to Reducing....
StormForge is the best choice for ML workloads. Their GPU optimization for Karpenter is unmatched. If you're running training jobs, use StormForge. If you're running web services, look elsewhere.
OpenCost (CNCF project) is free and open-source. It's good enough for small clusters. For anything production-scale, you'll need to build on top of it.
The decision comes down to this: do you want a dashboard that reports costs, or one that helps you optimize costs? Most tools do the first. Few do the second well Top 10 Kubernetes Cost Optimization Tools for 2026.
Why Standard Kubernetes Cost Monitoring Karpenter Dashboards Fail
I keep coming back to this because it matters. In mid-2025, a fintech company I advise ran a comparison: standard dashboards vs. custom-built Karpenter cost dashboards.
Standard approach showed their Karpenter cluster was 78% efficient. Custom approach showed 52% efficiency.
The gap was time-based provisioning. Their batch jobs ran for 4 hours, but Karpenter kept nodes alive for 6 hours because the pod disruption budget prevented early termination. The standard dashboard counted those 2 hours as "available capacity" (which is technically true) rather than "provisioning waste" (which is financially accurate).
That's $240,000/year in a 200-node cluster. Hidden by the standard dashboard.
The fix was adding a Grafana panel that tracks node_available_time / pod_running_time per provisioning decision. Simple change. Massive impact.
From Dashboard to Action: Closing the Loop
Dashboards are worthless if nobody acts on them. Here's the playbook we use.
Automate the Alerts
Every week, our kubernetes cost monitoring karpenter dashboards trigger alerts when:
- Provisioning efficiency drops below 0.6 for 2+ hours
- Instance type cost anomaly exceeds 2 standard deviations from rolling average
- Over-provisioning gap exceeds 40% for any namespace
These alerts go to Slack and trigger a GitHub issue in our platform repo with a suggested action.
Build a Cost Review Cadence
First Monday of every month, the platform team spends 90 minutes on a cost review. We project the dashboard and walk through each signal. The conversation isn't "why is our bill high." It's "which Karpenter provisioner is creating waste and how do we fix it."
We've tied this to sprint planning. Each cost improvement gets a story point estimate. Right-sizing a namespace is usually 2-3 points. Changing a provisioner configuration is 1 point. The ROI is almost always 10x+.
Use the Dashboard to Tune Karpenter Config
Karpenter's provisioner CRDs control which instances get provisioned. Your dashboard should tell you when to add constraints.
If you see consistent waste on large instances (m6i.8xlarge and above), add a constraint to prefer smaller instance types unless pods explicitly request high resources.
yaml
apiVersion: karpenter.sh/v1beta1
kind: Provisioner
metadata:
  name: cost-optimized
spec:
  requirements:
    - key: "karpenter.k8s.aws/instance-size"
      operator: In
      values: ["medium", "large", "xlarge"]
    - key: "karpenter.k8s.aws/instance-generation"
      operator: Gt
      values: ["5"]
  limits:
    resources:
      cpu: 1000
      memory: 4000Gi
  consolidation:
    enabled: true
This isn't about preventing large instances. It's about forcing Karpenter to justify them. If a pod truly needs 32 vCPUs, Karpenter will provision an xlarge or larger. But for the 90% of pods that don't, this constraint saves money.
The Enterprise Cost Optimization Checklist
If you're building a kubernetes cost optimization checklist enterprise, here's what we include.
- Karpenter Metrics: Are you collecting
karpenter_cloudprovider_instance_type_price_estimate? If not, fix this first. - Per-Workload Cost: Can you trace every dollar to a namespace and a deployment? Most orgs can't.
- Spot Instance Policy: Do you know which workloads can handle interruptions? Test it, don't guess.
- Right-Sizing Loop: Is there a recurring process to update pod requests based on actual usage?
- Provisioner Constraints: Do your provisioners reflect workload patterns or default configurations?
- Dashboard Ownership: Who looks at it? When? What happens when they see an anomaly?
- Billing Integration: Does your dashboard import actual cloud billing data or just estimate?
Item 7 is the biggest gap we see. Most Kubernetes cost tools estimate costs based on instance type pricing. They don't pull from AWS CUR or GCP billing data. In 2026, with reserved instances, savings plans, and EDP discounts, the estimated price and actual price can differ by 40%+.
The Contrarian Take: Karpenter Isn't Always Cheaper
Everyone's pitching Karpenter as a cost-saving tool. I've deployed it across 15+ clusters. Here's my honest take: Karpenter reduces waste when your workload is dynamic. It increases cost when your workload is stable.
For stable workloads with predictable pod counts, static node groups with reserved instances are cheaper. Karpenter's bin-packing flexibility adds overhead in instance startup time and potential spot interruptions. The AWS Compute Optimizer data backs this up: static clusters with proper RI coverage are 12-18% cheaper than Karpenter-managed clusters for steady-state workloads Karpenter vs Cluster Autoscaler: Which to Use in 2026.
The key insight: Karpenter optimizes for bin packing and instance diversity. It doesn't optimize for reserved instance utilization. If 70% of your workload is predictable, use static node groups for that 70% and let Karpenter handle the rest.
Your kubernetes cost monitoring karpenter dashboards should clearly show which workloads are in static groups vs. Karpenter. Don't lump them together. The cost dynamics are different.
Frequently Asked Questions
Q: How do I set up cost alerts in Karpenter dashboards?
Use Prometheus alerting rules on karpenter_cloudprovider_instance_type_price_estimate aggregated by namespace. Alert when daily cost exceeds a namespace budget by 20% for two consecutive days.
Q: Does Karpenter support spot instance cost tracking natively?
Karpenter exposes karpenter_cloudprovider_instance_type_price_estimate which includes spot pricing. But it doesn't track the actual cost of interruptions. You need to build a custom metric for eviction cost.
Q: What's the best Grafana dashboard template for Karpenter cost monitoring?
The community dashboard ID 18073 is decent for starting. But you'll need to add panels for provisioning efficiency and right-sizing gap. I prefer building from scratch using the three signal framework.
Q: How accurate are Karpenter's cost estimates compared to actual bills?
In our testing, Karpenter's estimates are within 5-8% of actual for on-demand instances. For spot instances, the variance is 15-25% because prices change faster than the caches update.
Q: Can I use Karpenter with GPU instances cost-effectively?
Yes, but you need tight constraints. Without them, Karpenter will provision p3 instances at $3/hour when your workload only needs t4 instances at $0.30/hour to latency requirements Smarter Cost Optimization with Karpenter: A Practical.... Use karpenter.k8s.aws/instance-accelerator constraints.
Q: How do teams manage cost allocation across departments?
Use namespace labels and enforce them with admission controllers. Each namespace gets a department label. Your dashboard aggregates by that label. Chargeback becomes trivial.
Q: What's the biggest mistake teams make with Karpenter cost dashboards?
They don't separate node cost from provisioned resource cost. A node costs $X/hour regardless of utilization. Your dashboard should show that fixed cost alongside the allocated cost.
The Bottom Line
Building kubernetes cost monitoring karpenter dashboards that actually save money requires shifting from reporting to optimization. Most tools in 2026 still report. You need to build the bridge from data to action.
Start with the three signals: provisioning efficiency, instance type cost correlation, and right-sizing gap. Instrument Karpenter with cloud provider metrics. Build a cost attribution model that maps scheduling decisions to actual spend. And for god's sake, connect your dashboard to your billing data.
The difference between a cluster that looks efficient and one that is efficient is about 25% of your bill. In a 1000-node cluster, that's $500,000+ per year.
Stop looking at utilization. Start looking at waste.
Nishaant Dixit — Founder of SIVARO. Building data infrastructure and production AI systems since 2018. Built systems processing 200K events/sec.