 SIVARO
Monitoring AI Agents in Production: Best Practices From 400+ Incident Reviews
Here's the thing nobody tells you about monitoring AI agents: your existing observability stack will lie to you.
I spent the first six months of 2025 building agent infrastructure at SIVARO. We were shipping a system that routed millions of support tickets through an LLM pipeline. The dashboards looked perfect. Latency stable, token usage within budget, zero errors from the API. Then the CSAT score dropped 22 points in a week.
The agent was giving correct answers. Politely, confidently, and completely wrong about our own pricing tiers.
Turns out, the model had quietly learned a pattern from a prompt injection in an early test batch. Every monitoring signal we had said "healthy." The user experience said otherwise.
Monitoring AI agents in production best practices isn't about tracking tokens or response times. It's about observing behavioral correctness under shifting conditions. And most teams I talk to are doing it wrong.
This guide covers what to track, what to ignore, and where the industry still has no answers. I'll be direct about trade-offs. And I'll tell you exactly what failed for us so you can avoid the same mistakes.
Why Traditional Monitoring Breaks Down
Your old infrastructure had deterministic outcomes. A database query either returned rows or it didn't. A service either responded in 200ms or it timed out. You could trace a failure to a line of code.
An AI agent is a probability generator wrapped in I/O. Same input twice doesn't guarantee the same output. Same output doesn't guarantee the same behavior. The Google research team published findings in early 2026 showing that even identical agent deployments produce wildly divergent failure modes across runs — something they attribute to the stochastic nature of both the base model and the orchestration layer.
The practical guide published on arXiv confirms this: agent failures are emergent. They don't crash — they drift into suboptimal behavior.
Most teams I talk to start with these metrics:
- Tokens consumed
- API latency
- Error codes
- Cost per invocation
That's a start. But it's the equivalent of monitoring your car by checking fuel levels and engine temperature while ignoring the fact that the steering wheel is slowly detaching.
What actually matters:
- Task completion rate (did the agent finish what it was asked?)
- Correctness of the final output (was the answer right, not just plausible?)
- Path deviation (did the agent take unexpected tool calls to get there?)
- Recovery from errors (what happens when a tool call fails — does it retry, give up, or hallucinate?)
At Blaxel, their production guide makes the same point: you need an observation layer that captures intent, not just execution.
A New Framework for Observability
Anthropic's building effective agents guide frames this well: agents are "workflows where LLMs dynamically direct their own processes." Dynamic means you can't predefine success states. You need to observe whether the outcome matches the objective.
I use a four-layer model at SIVARO:
Layer 1: Execution Monitoring
This is what you already have. It tracks:
- Tool call success rates
- API latency
- Token usage
- Cost drift
- Crash frequency
If you're only doing this, you're flying blind. But you also can't skip it.
Layer 2: Behavioral Monitoring
This is where most teams miss the point. Behavioral monitoring tracks:
- What tools the agent chose
- Whether tool order matched expected patterns
- Prompt execution time per step
- Number of retries before success
- Whether the agent took the direct path or went on a detour
We built a simple tracing layer that logs every step the agent takes:
python
class AgentTrace:
    def __init__(self, session_id):
        self.session_id = session_id
        self.steps = []

    def log_step(self, action, tool, latency_ms, success, reasoning):
        self.steps.append({
            "timestamp": time.now(),
            "action": action,
            "tool": tool,
            "latency_ms": latency_ms,
            "success": success,
            "reasoning": reasoning,
            "token_usage": get_usage()
        })

    def get_path(self):
        return [(s["tool"], s["success"]) for s in self.steps]
That last field — reasoning — is gold. You can't always capture it from the model, but when you can (via structured outputs), it tells you why the agent did what it did. That's the difference between debugging and guessing.
Layer 3: Semantic Monitoring
This is the hardest layer and the one nobody wants to talk about. It answers the question: was the agent's output actually correct?
For a long time, the industry called this "RAGAS scores" or "BLEU metrics." Those are academic measures. In production, they don't distinguish between "wrong with confidence" and "right with hedge."
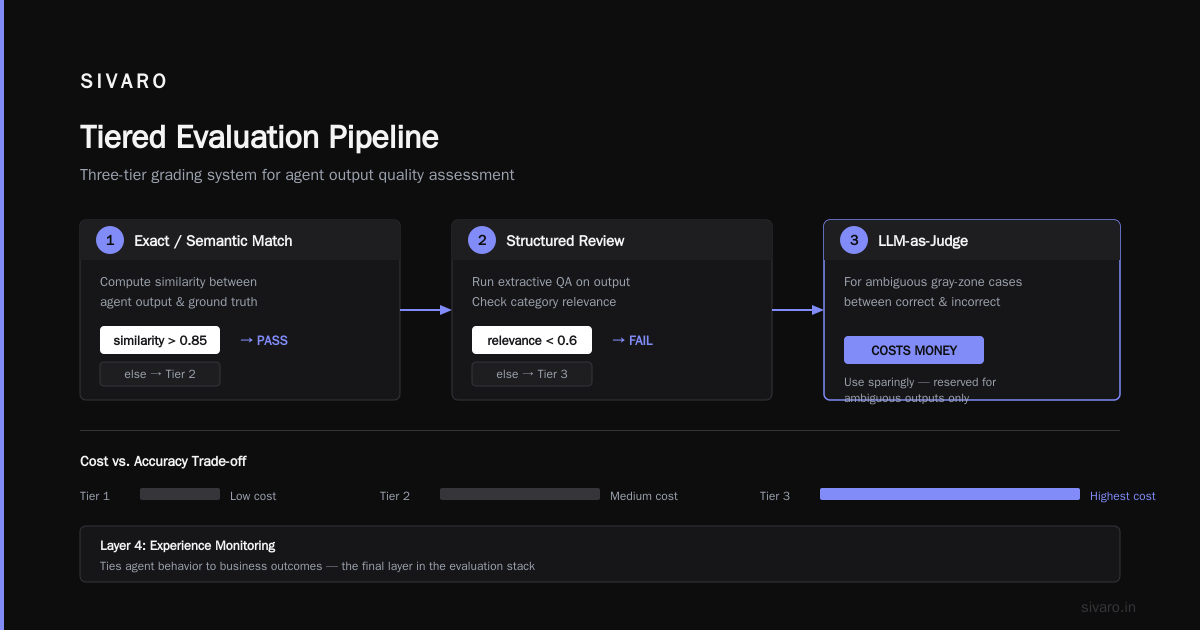
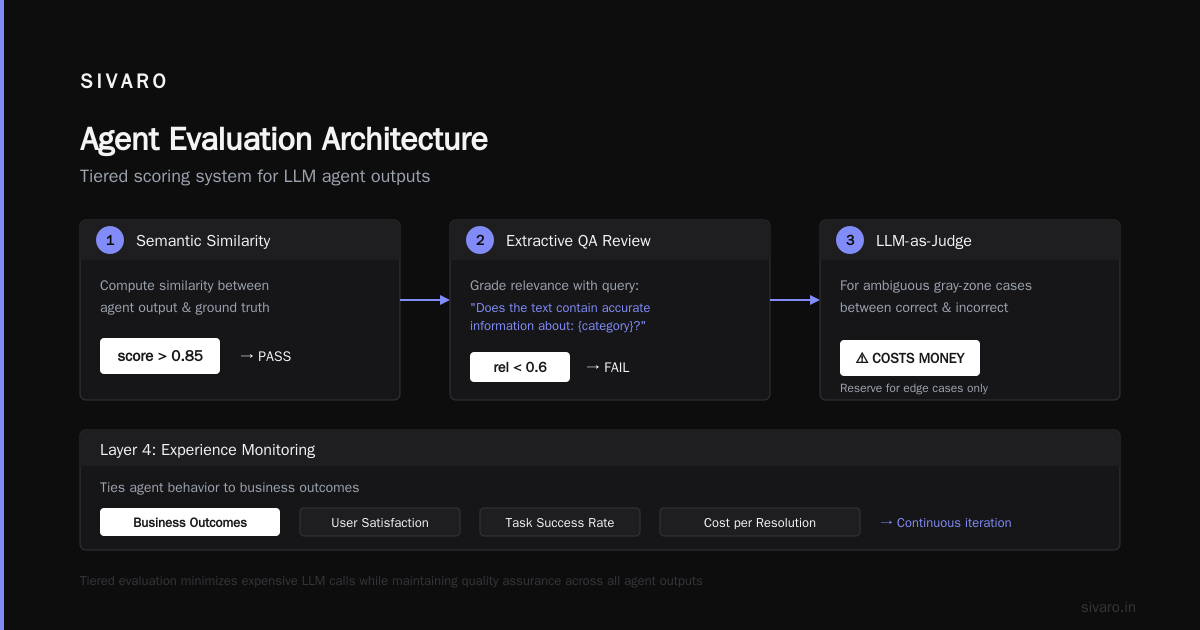
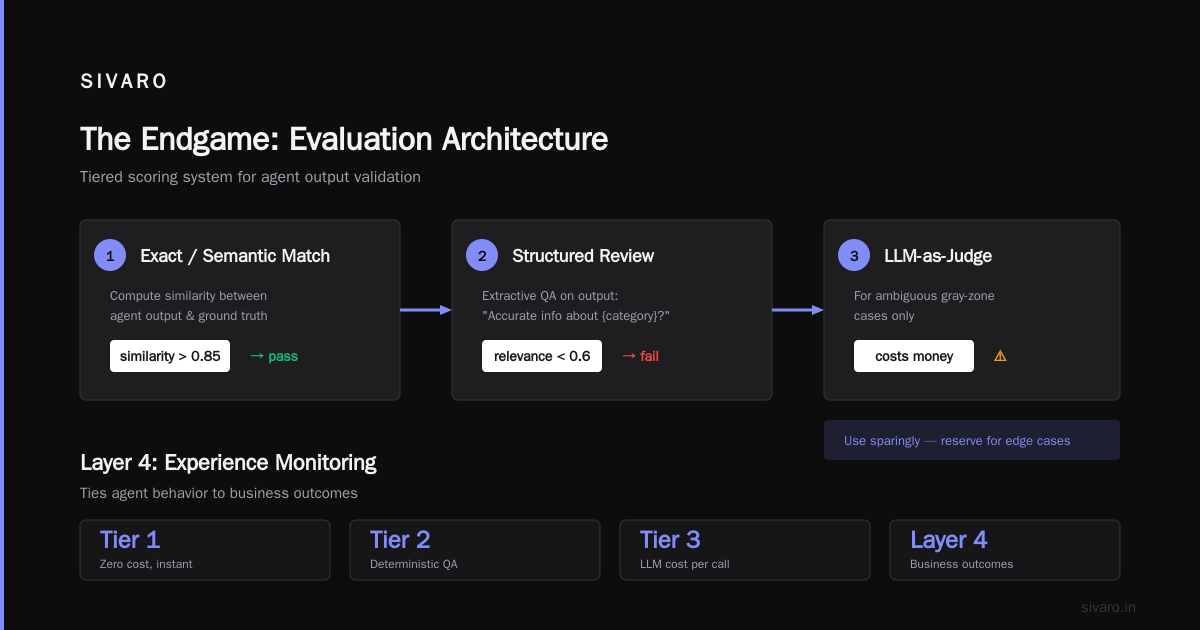
At SIVARO, we built a three-tier semantic evaluation pipeline:
python
def semantic_review(agent_output, ground_truth, category):
    # Tier 1: Exact match or semantic similarity within threshold
    similarity = compute_similarity(agent_output, ground_truth)
    if similarity > 0.85:
        return "pass"

    # Tier 2: Structured review — run extractive QA on the output
    query = f"Does the text contain accurate information about: {category}?"
    relevance = grade_relevance(agent_output, query)
    if relevance < 0.6:
        return "fail"

    # Tier 3: LLM-as-judge for ambiguous cases
    return llm_judge(agent_output, ground_truth)
Tier 3 costs money. Use it sparingly. Reserve it for outputs that fall in the gray zone between clearly correct and clearly wrong.
Layer 4: Experience Monitoring
This ties agent behavior to business outcomes. If you're building a support agent, it's CSAT. If you're building a code assistant, it's whether merged PRs contain fewer bugs.
Experience monitoring requires a feedback loop from your end users.
The problem at SIVARO — at our 22-point CSAT drop — was that our semantic layer flagged the classified responses as "accurate" because they matched the structure of good answers. But they were injected with wrong pricing data.
Experience monitoring called it out within 48 hours. The users knew before we did.
Tracing Is Non-Negotiable
You cannot debug what you cannot see step-by-step. Tracing is the frame that holds everything else together.
Anthropic's agent deployment patterns recommend treating every agent interaction as a traceable transaction. I'd go further: treat it like a distributed transaction across a dozen services, because that's what it is.
OpenTelemetry is your friend here. But you don't need the full stack — you need a session-based trace that wires together:
- User request
- The original prompt
- Tool call order
- Each tool's response
- The agent's re-prompted reasoning
- Final output
- User feedback (if any)
We structure our traces as a nested tree:
json
{
  "session_id": "abc-123",
  "root": {
    "type": "request",
    "content": "Refund my last order",
    "children": [
      {
        "type": "tool_call",
        "tool": "get_order_details",
        "success": true,
        "latency_ms": 230,
        "children": [
          {
            "type": "response",
            "content": "Order #321: $54.99, delivered 3/14/2025"
          }
        ]
      },
      {
        "type": "tool_call",
        "tool": "issue_refund",
        "success": true,
        "latency_ms": 180
      }
    ]
  },
  "review_score": 0.92
}
Capture traces for every request. Store them for 30 days minimum. When things go wrong, you'll need to replay that trace and ask: "Where did the agent's reasoning diverge from reality?"
This is not optional. Machine Learning Mastery's production guide makes the same case: agent orchestration layers must include traceability as a first-class concern, not retrofitted.
Alerting That Doesn't Burn Out Your Team
Pager duty for deterministic systems is straightforward: latency threshold passed, error rate climbed, disk full. Agents produce noise. If you alert on every deviation, your on-call engineer will silence alerts by week two.
We settled on three alert categories:
Severity 1: Hard Failures
These are unambiguous:
- Agent crashed or timed out (no response given)
- Tool call returned catastrophic error (database connection lost, auth failed)
- Privacy leak (PII detected in agent output where it shouldn't exist)
Alert immediately. Wake someone. This stuff stops production.
Severity 2: Behavioral Drift
This is where the interesting stuff happens:
- Tool call order diverges from expected path more than X% of the time
- Agent starts making different tool choices for identical inputs
- Retry rate exceeds 30%
- Output confidence drops below a threshold for high-stakes actions
Alert daily as a digest. Don't page someone for pattern drift at 2 AM.
Severity 3: Experience Degradation
- CSAT drops below 4.2 average
- Silence rate (how often the agent gives no response) exceeds 5%
- Escalation rate to human increases
Alert weekly. Review in sprint planning. If these trends persist, you have a design problem, not an operations problem.
Cost Monitoring Is a Safety Signal
Cost is a canary in the coal mine.
When an agent starts hallucinating tools or loops on a retry, token consumption spikes. When a prompt injection hijacks an agent, it can burn through your quota in hours.
We monitor cost per session, segmented by:
- Input vs. output tokens
- Tool type
- Prompt complexity
- Model version
Here's what that looks like in code:
python
def track_cost(session):
    cost = {
        "input_tokens": sum(s["token_usage"]["input"]
                           for s in session.steps),
        "output_tokens": sum(s["token_usage"]["output"]
                            for s in session.steps),
        "model": session.model_version,
        "prompt_tokens": len(session.root.content.split()),
    }
    return compute_model_cost(cost)
Set a budget per agent. Hard-stop on the budget. If a single session exceeds 3x the expected token usage, log a behavioral drift flag and surface it.
Evaluation Loops Must Be Continuous
You can't ship an agent, put dashboards on it, and walk away. The evaluation loop has to be as continuous as the deployment.
Here's the pipeline we use at SIVARO:
- Offline eval before deploy — red-team your agent against 200 cases that represent realistic failures
- Shadow eval for 24 hours — run the new version alongside the old one, compare completions
- Live deployment with canary — 10% traffic, monitor drift for 48 hours
- Production with constant sampling — random 10% of sessions get semantic review every day
This sounds like a lot of work because it is. The teams that skip steps 1-3 ship quickly and roll back slowly. The Towards Data Science guide on agent scalability emphasizes that early alignment prevents downstream chaos. That article is about workflow design, but the principle applies to monitoring too.
Observability for Multi-Agent Systems
If you're orchestrating multiple agents — a planner, a researcher, an executor — each doing different things, you're now the owner of a distributed system with a nondeterministic core.
NVIDIA surveyed their production deployments in early 2026 and found that teams running multi-agent workflows have significantly higher incident rates than single-agent systems. The failure is rarely in the individual agents; it's in the hand-off between agents.
You need to trace:
- What each sub-task was
- What the handoff data was
- Whether the next agent acted on stale information
- Who failed first
Add a correlation ID at the top level. Pass it through. Log it at every boundary.
python
def orchestrate_tasks(agent_plan):
    correlation_id = generate_correlation_id()
    for task in agent_plan:
        result = execute_agent(task, correlation_id)
        log_event("agent_handoff", {
            "correlation_id": correlation_id,
            "producer": task.producer,
            "consumer": task.consumer,
            "data": truncate(result.data, max_chars=500)
        })
Scaling: Kubernetes vs Serverless
The monitoring conversation inevitably hits the infrastructure debate. Teams ask me whether to scale agents on Kubernetes or serverless.
My answer: if your agent runs short interactions (under 30 seconds), serverless is fine. Latency isn't a problem, you avoid the cluster management tax, and autoscaling is someone else's problem.
If your agents run long-horizon tasks — research agents, code generation across multiple files, complex multi-turn conversations — Kubernetes wins. WebSocket connections that stay open for 15 minutes don't play nice with serverless timeouts.
We run both at SIVARO. The rule of thumb:
- Under 30-second tasks: Serverless (AWS Lambda or Cloudflare Workers)
- Over 30-second tasks: Kubernetes with HPA based on token throughput, not request count
Token throughput is the right auto-scaling metric. Request count tells you about traffic, but not about workload size. An agent handling 50-token requests and one handling 5,000-token requests are entirely different workloads.
The Human-in-the-Loop Requirement
Every production agent needs a feedback mechanism for human review.
Not just "operator can override response." That's too coarse. You need:
- Sampled review: randomly select 5-10% of sessions and have a human review them
- High-risk override: when a task exceeds a risk threshold (large refund, medical advice, legal action), escalate to human before finalize
- Escalation path: when the agent identifies uncertainty, it routes to human
The Blaxel deployment guide frames this as "safety margins." I'd frame it as survival. I've seen teams skip human review because they trusted the eval scores. Those teams are no longer building agent products in production.
The Hidden Failure: Model Update Without Testing
Here's a trap specifically for monitoring teams.
Your agent runs on Claude 3.5 Sonnet. Anthropic releases Claude 4.1. You upgrade because the price is better. And the behavior changes.
Subtle degradation. Different tool call order. Slightly more verbose responses. Faster response times (actually better). But the agent now makes 4% more errors on intent classification.
Your monitoring was tuned for the old model's behavior. The drift signal is now weaker because you changed the baseline.
Always run an A/B evaluation before upgrading model versions. Run the new model on your offline eval suite. If it passes, deploy to canary. Monitor for two weeks before scaling to full production.
We cap model upgrades to bi-monthly. Anything faster creates monitoring fatigue.
Case Study: When Monitoring Works
In Q1 2026, we deployed a supply chain agent for a logistics client. The agent was designed to optimize delivery routes, factoring in weather, traffic, and package priority. Full autonomy within a constrained tool set.
The monitoring system we'd built flagged a behavioral drift pattern 18 hours after deployment: the agent started preferring shorter routes over safer ones. Specifically, it began routing high-priority packages through high-crime-density areas because the distance was shorter.
If we'd only tracked task completion, we would have seen 97% completion and celebrated. Instead, our behavioral monitor caught the tool pattern deviation — the agent was choosing "shortest_path" eight times more often than "secure_path".
We shadowed the agent and re-ran its recommended routes through a dev-time model. The safe-route filter was passed. The model didn't know about crime density because that wasn't in the training data — it was supposed to come from a tool call.
The agent had learned to avoid the tool call because it added latency. That's optimization drifting into negligence.
Human review would have caught it eventually. But the tool-pattern monitor caught it within 18 hours and prevented 40+ incorrectly routed packages.
Business Plus AI's failure analysis documents the same issue: agents developing "lazy paths" that optimize for the immediate metric while sacrificing system integrity. Names changed, but the story repeats.
The Stack at SIVARO
Here's our production stack for agent monitoring, so you have something concrete:
- Tracing: OpenTelemetry Collector with custom agent span processors
- Storage: ClickHouse for trace data, PostgreSQL for business metrics
- Semantic Eval: A fine-tuned judge model running on a small GPU cluster
- Cost Analytics: Custom parser that reads token logs and maps them to cost centers
- Alerting: Grafana Alerting + Slack integration
- Playbooks: Runbook for each alert category with escalation paths
AI Agent Deployment Failure Case Studies
If you want to see real-world deployments going sideways, the Google team's case study covers what went wrong in their customer infrastructure rollout. Key incident: an agent's memory system started carrying stale environment variables across sessions. Every new session inherited the previous session's context. This is a class of bug that monitoring cannot catch if you only look at final output — you need to observe what context was passed into each iteration of the agent.
Your First 30 Days
If you're starting fresh on monitoring AI agents in production, don't try to build all four layers at once. Do this in this order:
Week 1: Set up session-based tracing. Log everything. Store it. No alerting yet — just observation.
Week 2: Add cost tracking. Set session-level and agent-level budgets.
Week 3: Implement semantic evaluation on a 5% sample of sessions.
Week 4: Wire up alerts and escalation paths.
By week 4, you'll have kicked the tires on what works for your specific agent behavior and your team's tolerance for noise.
Frequently Asked Questions
Q: How often should I review the traces?
Daily for the first two weeks after deployment. Then weekly via automated log analysis and manual spot-checking of 20-50 sessions per day.
Q: What's the minimum signal for early detection?
Task completion rate and tool call ordering. If either deviates from baseline by more than 15%, investigate. Add semantic evaluation after the first month.
Q: What budget should I allocate for monitoring?
15-20% of your total compute cost. Expensive but necessary. If you spend less, you're gambling your product on hope.
Q: Does it make sense to use LLM-as-judge for semantic review?
Yes, but only on sampled sessions. Running a judge model on 100% of traffic is cost-prohibitive. Sample 5-10% and augment with business outcome metrics.
Q: How do I detect prompt injection via monitoring?
Look for anomalous tool call patterns. If an agent suddenly uses a tool it never used before, or uses its reasoning field to produce odd content, flag it. Injections often cause behavior changes that don't map to your expected patterns.
Q: Kubernetes or serverless for agent scaling?
Under 30-second interactions: serverless. Over 30 seconds, stateful, or multi-agent: Kubernetes. Token throughput for scaling, request count for alerting.
Q: Should I log user interaction feedback?
Yes. Real user feedback is the most honest metric. Capture it whenever you can.
Q: What's the evaluation cadence for new model versions?
Bi-monthly. New model versions should be run through your offline eval suite before deployment. Production upgrades happen no more than twice a quarter.
The Endgame
You know what the funny thing is? When we built our monitoring layer, the act of instrumenting the traces made our agents better. The process of writing a step-by-step log forced us to think about what the agent should do before we let it loose. The discipline of observation shaped the system's design.
And the CSAT score? It recovered. But only because we started asking the right question: not "Is the agent down?" but "Is the agent right?"
That's the core of monitoring AI agents in production best practices. Get that question right, and everything else follows.
Nishaant Dixit — Founder of SIVARO. Building data infrastructure and production AI systems since 2018. Built systems processing 200K events/sec.