 SIVARO
Observability for Production AI Agents: What Your System Isn't Telling You
August 1, 2026. Two weeks ago, I sat in a war room with a fintech client whose AI agent had been approving loans it shouldn't have. The model was fine. The pipeline looked clean. The latency metrics were green across the board. Yet the agent was making bad decisions — silently, confidently, for three months. That's the problem with production AI agents. You can monitor CPU, memory, request latency, and still have zero idea what's actually happening inside the agent's brain.
Observability for production AI agents is not about dashboards. It's not about logging every API call (though you should). It's about reconstructing the chain of reasoning, tool calls, and model outputs that led to a specific decision — and doing it fast enough to stop a disaster before it compounds.
This guide is for engineers building agent systems right now. You'll learn what observability actually means for AI agents, which signals matter (and which don't), how to instrument agent loops without killing performance, and the hard trade-offs I've seen teams make — and often regret.
Why Traditional Observability Breaks for AI Agents
Most teams start by instrumenting agents the same way they'd instrument a microservice. They add OpenTelemetry spans for each API call, push metrics to Datadog, set up logs in Splunk. Then they deploy an agent that calls a tool, gets a response, calls another tool, generates a final answer — and everything looks fine. Except the agent hallucinated a customer's account number, and their support team spent four days chasing a ghost.
Traditional observability (metrics, distributed traces, logs) assumes deterministic execution. Each HTTP request has a status code, a duration, a known outcome. AI agents are probabilistic. The same prompt can produce different outputs. The same tool call can succeed or fail based on context from three steps ago. You can't debug a stochastic system with deterministic tools. AI Agent Failures: Common Mistakes and How to Avoid Them lists "lack of semantically rich logging" as one of the top three causes of prolonged post-mortems. I'd put it at number one.
The core gap: traditional observability asks "what happened?" Agent observability needs to answer "why did the model think that was the right thing to do?" That requires capturing the model's internal reasoning trace, the state of the conversation window, and the exact tool response that the model saw — not just the fact that a tool was called.
The Three Pillars of Agent Observability: Trace, Log, Evaluate
At SIVARO, we've settled on a framework that covers the unique failure modes of agents. I didn't invent it — it's adapted from practices at companies like Anthropic and Google, combined with our own battle scars. A Practical Guide for Designing, Developing, and ... calls this "multi-modal observability." I call it "the three things you can't skip."
1. Traces with Semantic Context
A span that says "tool_call:get_balance took 1.2s" is useless. A span that says "tool_call:get_balance | agent_id=loan-approval-v2 | input='account_id=12345' | output='{balance: 42000, currency: USD}' | model_decision='approved_with_conditions'" is gold.
You need to attach the actual inputs and outputs to each span — not just metadata. This is expensive. Storing full model responses at scale can blow your storage budget. But without it, you're blind. We started by sampling 1% of traces and learned nothing. Now we store full traces for 100% of production traffic for 48 hours, then downsample to 10% for long-term storage. Cost went up 3x. Debugging time dropped 10x.
python
# Python: OpenTelemetry-compatible agent span with semantic payloads
from opentelemetry import trace
from opentelemetry.sdk.trace import TracerProvider
import json

tracer = trace.get_tracer("agent-observability")

class AgentTracer:
    def __init__(self, agent_id: str, session_id: str):
        self.agent_id = agent_id
        self.session_id = session_id

    def start_step(self, step_name: str, input: dict):
        span = tracer.start_span(step_name)
        span.set_attribute("agent.id", self.agent_id)
        span.set_attribute("session.id", self.session_id)
        span.set_attribute("step.input", json.dumps(input))
        return span

    def end_step(self, span, output: dict, model_response: str = None):
        span.set_attribute("step.output", json.dumps(output))
        span.set_attribute("step.model_response", model_response)
        span.end()
This is the baseline. If you don't have this, everything else is guessing.
2. Logs That Capture the Reasoning Chain
Model responses are not logs — they're data. But you need logs for things that are not model output: token count, retry attempts, tool timeouts, permission checks, context window overflow warnings. These are the "infrastructure" logs that explain why the agent's reasoning path changed.
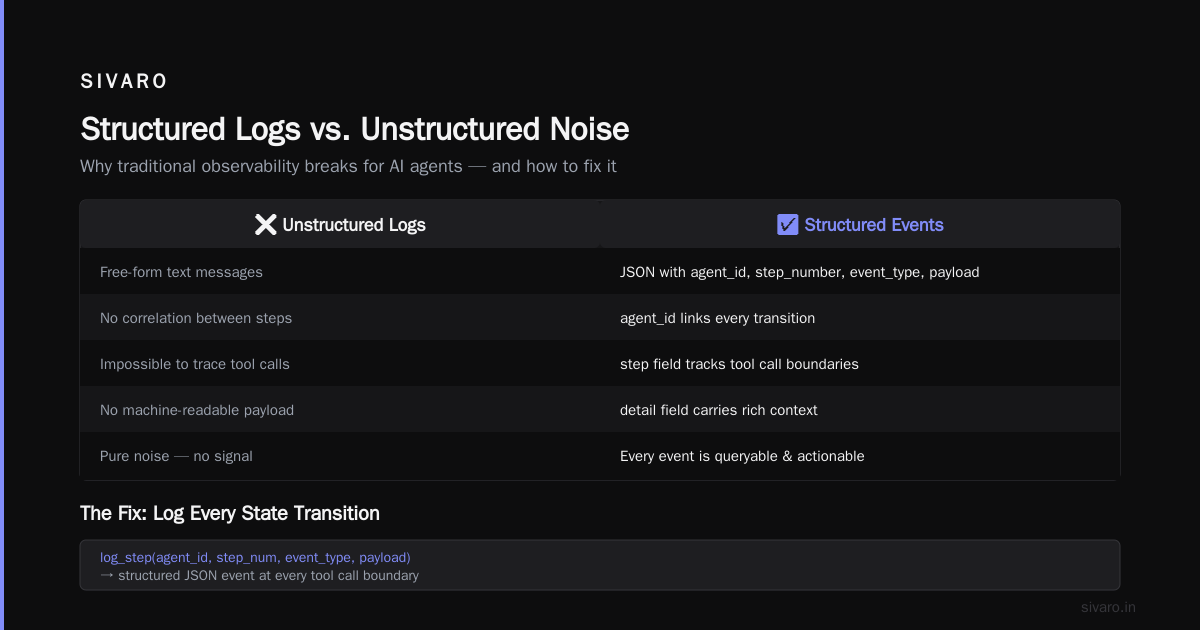
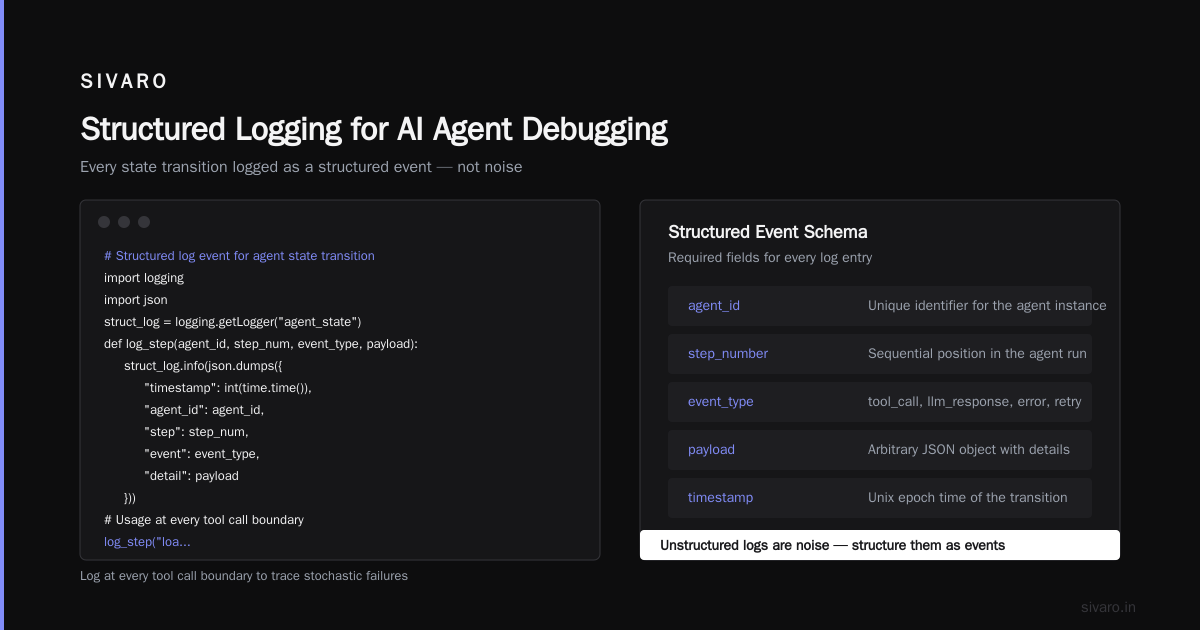
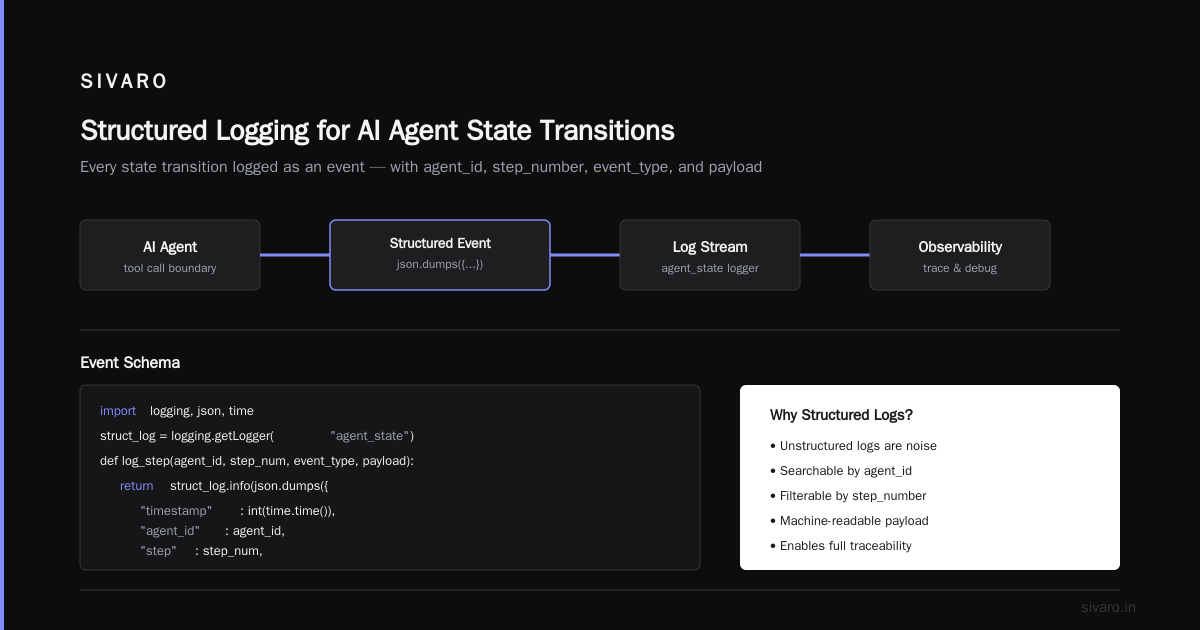
We've seen agents silently truncate their reasoning when the context window hits 80% capacity, then make flawed decisions on the remaining tokens. Without a log event at that truncation point, you'd never know. How to Deploy AI Agents to Production: A Complete Guide recommends logging every state transition. I agree — but only if you structure those logs as events with an agent_id, step_number, event_type, and payload. Unstructured logs are noise.
python
# Structured log event for agent state transition
import logging
import json

struct_log = logging.getLogger("agent_state")

def log_step(agent_id, step_num, event_type, payload):
    struct_log.info(
        json.dumps({
            "timestamp": int(time.time()),
            "agent_id": agent_id,
            "step": step_num,
            "event": event_type,
            "detail": payload
        })
    )

# Usage at every tool call boundary
log_step("loan-v2", 3, "tool_call_started", {"tool": "get_balance", "account": "12345"})
log_step("loan-v2", 3, "tool_call_succeeded", {"result": "42000"})
3. Evaluation as a First-Class Signal
Metrics and traces tell you the agent ran. Evaluation tells you it was right. This is the pillar most teams ignore until after an outage. You need to run automatic evaluations on agent outputs in production — not just offline on test sets. We call this "continuous eval."
At SIVARO, we pipe every agent response through a suite of evaluators: factual consistency (does the answer match retrieved context?), safety (does it violate guardrails?), and task completion (did it take the intended action?). The results become metrics. If factual consistency drops below 0.85 for 5 minutes, we page.
python
# Pseudo: production evaluation hook
class ProductionEvaluator:
    def evaluate(self, agent_output, context):
        factual_score = self.check_factual_consistency(
            agent_output["final_answer"],
            context["retrieved_documents"]
        )
        safety_score = self.safety_classifier(agent_output["final_answer"])
        completion_score = self.task_completion(
            agent_output["actions_taken"],
            agent_output["intended_actions"]
        )
        return {
            "factual": factual_score,
            "safety": safety_score,
            "completion": completion_score
        }
This evaluation becomes an observability signal. Not just "the agent took 2.3s" but "the agent took 2.3s and scored 0.93 on factual consistency — that's a warning."
Instrumenting Agent Loops: From Tool Calls to Model Responses
The hardest part is deciding what to instrument. Everything is too granular. Nothing is enough. The trick is to instrument at the boundaries of the agent's "cognitive steps" — not every token, but every decision point.
Building Effective AI Agents describes agent loops as a sequence of "think, act, observe." Instrument each phase. The "think" phase produces a reasoning trace (often hidden in the model's internal monologue). Capture that as a span. The "act" phase produces a tool call. Capture the input and output. The "observe" phase produces the tool's return value. Capture that too.
But here's the contrarian take: don't capture the raw model response tokens verbatim. That's expensive and often useless. Instead, extract the structured decisions — the tool name, arguments, chosen action — and store those. If you need the raw reasoning, you can reroute the model to write it into a structured field (e.g., "reasoning": "I chose account 12345 because..."). This is cheaper and more actionable.
We once debugged an agent that kept calling a CRM API with the wrong customer ID. Raw token analysis showed the model reasoning was correct, but the agent's context window had duplicated a previous conversation turn. The symptom looked like a prompt bug. The real problem was context management. Without step-by-step logg of context state, we'd never have found it. Learn These Key Hurdles to Deploy Production AI Agents ... from Google Research calls this "context contamination" — one of the top failure patterns they've observed.
What to Monitor: Latency, Quality, Drift, and Cost
Every observability system needs a signal selection strategy. Here's what matters for AI agents, ranked by how often they predict real outages.
-
Latency distribution by agent step – Not overall latency, but which step is slowest. We set alerts at p99 of the "tool execution" step separately from the "model reasoning" step. If model reasoning jumps from 2s to 10s, it's usually a prompt reformat issue or context overflow.
-
Factual consistency score – As described above. This is your canary. When it drops, something is wrong with retrieval or the model's grounding.
-
Drift in tool call patterns – The agent suddenly stops calling a tool it used to call. Or starts calling a deprecated tool. This is a classic sign of prompt hacking or model update regression.
-
Cost per session – Agents can spiral. We saw one agent that retried a tool call 47 times in a single session because the tool kept returning a transient error. The agent refused to stop and try something else. Cost went from $0.03/session to $4.20. That's not a server issue; that's an agent design issue. Observability caught it because we tracked total tokens per session.
Deploying AI Agents to Production: Architecture ... suggests monitoring the "agent cycle count" — number of tool calls per request. I'd add: monitor the variance too. A high standard deviation in cycle count often means the agent is confused and looping.
Alerting on Agent Behavior: It's Not Just p99
Most teams set alerts on latency and error rate. For agents, you need alerts on behavior patterns.
At SIVARO, we have an alert called "agent-stuck-loop." It fires when:
- Same tool called more than 5 times in a row with the same arguments
- Factual consistency below 0.7 for three consecutive responses
- Session duration exceeds 120 seconds
These are not traditional metrics. They're custom aggregations over traces. You need a tool that can query trace attributes, not just metrics. We use a combination of OpenTelemetry Collector with custom processors and a lightweight rule engine that scans spans every 30 seconds.
yaml
# OpenTelemetry Collector configuration snippet: agent loop detection
processors:
  filter:
    error_mode: ignore
    traces:
      span:
        - 'attributes["step"] == "tool_call" and attributes["tool_name"] != ""'
  groupbyattrs:
    keys:
      - session.id
      - agent.id
    aggregate_metrics:
      - metric_name: consecutive_same_tool_call
        units: "1"
        value_type: int
        # Count consecutive identical tool_name values per session
The alert rule: if consecutive_same_tool_call > 5, notify on-call. This has caught real issues three times in the past month.
The Debugging Nightmare: Stochastic Failures and Non-Determinism
I'll be honest: debugging agent failures is brutal. A traditional bug reproduces with the same inputs. An agent bug might reproduce 1 time in 10. The first time it fails, the logs say one thing. The second time it fails, the logs say something else.
We've learned to treat every agent failure as a "non-reproducible until proven reproducible." That means building tooling for replay. When an agent session fails, we capture the entire session state — every model request, every tool response, the internal reasoning chain — and store it as a replay artifact. Then we can feed that exact sequence back into a test environment to debug.
A Developer's Guide to Building Scalable AI: Workflows vs ... makes a distinction between "deterministic workflows" and "probabilistic agents." Observability for the latter requires storing not just outcomes, but the probability distribution of outcomes. At minimum, track the model's confidence score for each decision if available. Some models output log probabilities for tool calls. Capture that. If the agent chose "get_balance" with 0.4 probability and "get_overdraft" with 0.39, you need to know the decision was borderline. That's a red flag for future failures.
We built a custom dashboard that shows the "entropy" of the agent's last decision — a derived metric from the softmax distribution of the model's token predictions at the decision point. When entropy spikes, the agent is uncertain. That alone is a better predictor of bad outcomes than any p99 latency.
Eval-Driven Observability: Closing the Loop
Here's where most articles get fluffy. I'll be concrete.
We run evals continuously in production. Every agent response goes through a lightweight evaluator (usually a smaller, faster model like Claude Haiku or GPT-4o-mini) that checks:
- Did the agent follow the instruction (task completion)
- Did the agent avoid banned patterns (safety)
- Did the agent use the correct tool with correct parameters (tool adherence)
Then we compute a composite "agent quality score" per hour. This becomes observability signal. If quality drops below 0.8, we automatically enable shadow mode for new sessions — the agent keeps running but its decisions are also checked by a human-in-the-loop. The metric itself becomes a trigger for infrastructure action.
This is not futuristic. We're doing it in production today, August 2026, for a retail logistics client. Their agent dispatches drivers. If quality score drops, dispatches are paused and a human reviews. The observability system is the gate.
Tools and Infrastructure: Our Stack at SIVARO
You asked what we actually use. Here's the honest answer — no vendor push, just what works.
- Tracing: OpenTelemetry with custom span processors for agent-specific attributes. We export to a self-hosted Tempo cluster (Grafana's trace store) because we need long retention of complex traces. Cloud offerings get too expensive after 10M spans/day.
- Logs: Structured JSON logs to Loki, indexed by agent_id and session_id. We keep 7 days hot, 30 days warm, 90 days cold.
- Metrics: Prometheus with a custom exporter that reads trace data and computes agent-specific metrics like tool call frequency, factual consistency, cost per session. We push an alert to PagerDuty when any of our 12 agent-specific rules fire.
- Evaluation: A lightweight sidecar that runs the evaluator model as a service alongside the agent. We cache evaluation results to avoid re-evaluating repeated outputs.
- Replay Store: A PostgreSQL + S3 system. Active sessions write to PostgreSQL for fast lookup. Sessions older than 2 days are archived to S3 as Parquet files, queryable via Presto.
This stack costs about $4,500/month for a deployment handling 500K agent requests/day. Could we do it cheaper? Yes, but we'd lose the ability to debug the stochastic failures. At SIVARO, we treat observability as a feature, not an ops overhead.
Common Mistakes Teams Make (And How We Fixed Them)
I've seen the same patterns at five different clients this year.
Mistake 1: Sampling traces randomly. Random sampling means you miss the rare failures. We now sample based on agent behavior — 100% of sessions that involve a retry, or have high entropy, or exceed cost thresholds. AI Agent Failures: Common Mistakes and How to Avoid Them calls this "failure-biased sampling." It's the only sane approach.
Mistake 2: Only monitoring the final response. The agent's final output might be perfect, but the reasoning path might be insane. We had an agent that called 14 API services to answer "What's my balance?" — because it kept dismissing the first correct answer and searching for more "evidence." Final output was correct. Cost was 400x normal. Observability caught the tool call explosion but only after we added step-level cost tracking.
Mistake 3: Not evaluating evaluation. The evaluator model itself can be wrong. We track false positive and false negative rates of our evaluator by periodically labeling a sample of its outputs. If false negative rate exceeds 5%, we retrain the evaluator prompt.
Mistake 4: Ignoring context window pressure. Monitor the token usage per session. When it approaches the model's context limit, log a warning. We've seen agents silently truncate their reasoning at 80% capacity and then make random decisions. That should be an immediate alert.
The Future: Observability as a Core Agent Component
By 2027, I expect every major agent framework to ship observability as a built-in module — not an afterthought. The frameworks that don't will be abandoned. LLM providers are already starting to emit observability signals: Anthropic includes token-level cost in their API responses, OpenAI has started to expose logprobs more easily. But orchestration-layer observability (the agent's decision loop) is still manually instrumented.
If you're building an agent system today, design the observability layer first. Before you write the tool handler, write the span wrapper. Before you deploy your first prompt, deploy the evaluation sidecar. It's boring. It saves weeks.
Our own playbook at SIVARO: every agent release includes a "observability readiness review." If the agent doesn't emit traceable decision points, it's not production-ready. That's a strong stance. It's caused friction with engineers who want to ship fast. But we've never regretted it.
FAQ
Q: Do I need to store every model response for observability?
Not forever. Store full traces for at least 48 hours. Then downsample to retain a statistically valid set for drift analysis. But for debugging, you need at least a few days of unfiltered data.
Q: What's the cheapest observability setup for a solo developer?
Start with structured logging to stdout and a free tier of any log aggregation (like Grafana Cloud's free Loki). Add a single custom metric for "agent steps per session." That's enough to catch most spirals.
Q: How do I debug an agent that fails only once out of every 20 runs?
Capture the full session trace of the failure and replay it in an offline environment. If you can't reproduce it, the issue is likely non-deterministic model output, not code. You need to compare the model's token probabilities between success and failure traces.
Q: Should I use a separate model for evaluation?
Yes, a smaller model is fine for most checks. We use Claude 3.5 Haiku for factual consistency and safety. It's fast and cheap enough to run on every response. For rare hard cases, we fall back to a larger model.
Q: How often should eval scores trigger alerts?
If factual consistency drops by more than 10% in a 5-minute window, that's an alert. If composite score stays below 0.7 for 10 minutes, that's a page. Adjust thresholds based on your agent's baseline — we had to lower ours because our agent was already aggressive.
Q: Can observability prevent AI agent outages?
No. But it can cut mean time to detection from hours to minutes, and mean time to recovery from days to hours. That's the real value.
Q: What's the dumbest observability mistake you've seen?
A team that logged agent outputs but not tool call arguments. They knew the agent said "I found your account." They didn't know which account it found — the wrong one. That's not observability, that's theater.
Author: Nishaant Dixit — Founder of SIVARO. Building data infrastructure and production AI systems since 2018. Built systems processing 200K events/sec.