 SIVARO

Queue Based Admission Control for LLM Serving
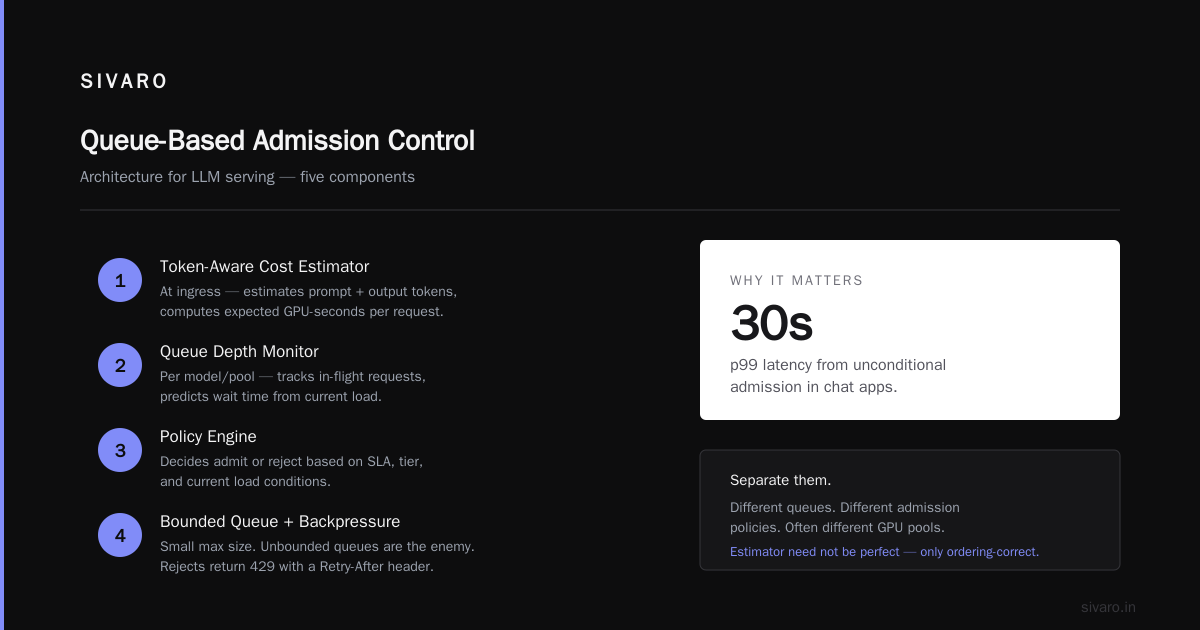
Queue based admission control for LLM serving is the practice of deciding whether to accept a request before it enters your inference queue, rather than letting every request pile up and hoping the GPU catches up.
Most teams learn this the hard way. They build a slick endpoint, traffic doubles, and suddenly every user gets a 40-second response instead of a fast one. The GPU was never the bottleneck. The queue was.
I've seen this pattern across a dozen production systems since 2024, and it always rhymes. You add capacity, latency improves for a week, then collapses again because you're admitting every request unconditionally.
Here's what this article covers: what admission control actually is, why naive FIFO queues destroy tail latency, how to design a queue based admission control for LLM serving system that respects GPU economics, and the Kubernetes bits that make it real. There's a genuine tradeoff here between GPU utilization and admission control, and I'll be honest about where I've gotten it wrong.
Why unconditional admission kills LLM serving
Traditional web services handle overload by queueing. Request comes in, sits in a queue, gets served. That works when each request costs roughly the same.
LLM inference doesn't work like that.
A short prompt with 10 output tokens finishes in under a second. A 4K-context summarization with 2K tokens of output can hold a GPU for 30+ seconds. Same endpoint, same queue, wildly different cost.
When you admit both indiscriminately, the expensive request blocks everything behind it. Your p99 latency doesn't degrade gracefully. It explodes.
I watched this happen at a fintech client in early 2026. Their support-copilot endpoint averaged 800ms at low traffic. At 3x traffic, p50 stayed under 2 seconds but p99 hit 47 seconds. Users assumed the service was down. They weren't wrong.
The fix wasn't more GPUs. It was refusing to accept work they couldn't serve in a bounded time.
What admission control actually means
Admission control is a decision at the front door. A request arrives. You ask two questions: can I serve this within an acceptable time, and should I?
The "can I" is capacity. Do I have a free slot, or a queue position that predicts sub-SLA completion?
The "should I" is policy. Is this request from a paying tier? Is it a retry? Does it have a deadline that's already blown?
If the answer is no, you reject. Fast. With a 429 or 503 and a Retry-After header. That sounds brutal until you realize the alternative — a request that sits in queue for 45 seconds and then fails — is worse for everyone.
The distinction that matters: admission control happens before queueing, not after. Load shedding happens after queueing, by dropping work that's already admitted. Both have their place, but admission control is the one that protects tail latency.
The GPU utilization vs admission control tradeoff
Here's the thing nobody tells you when you're optimizing your first LLM endpoint.
Rejecting requests lowers GPU utilization. Full stop.
If your GPU is at 95% utilization, you're serving almost everything that arrives. Your latency is probably awful, but your utilization number looks great in a dashboard. Executives love it. Users hate it.
If your GPU is at 70% utilization, you're leaving compute on the table — but you're serving every admitted request with predictable latency.
I take a clear position here: for interactive LLM serving, aim for 65–80% GPU utilization, not 95%. The headroom is what buys you tail latency stability. The last 20% of utilization is dramatically more expensive in latency than the first 80%.
But there's a subtlety. For batch inference — offline jobs, nightly summarization, RAG index building — you want the opposite. Push utilization to 95%+. Nobody cares if a batch job takes 6 hours instead of 5.
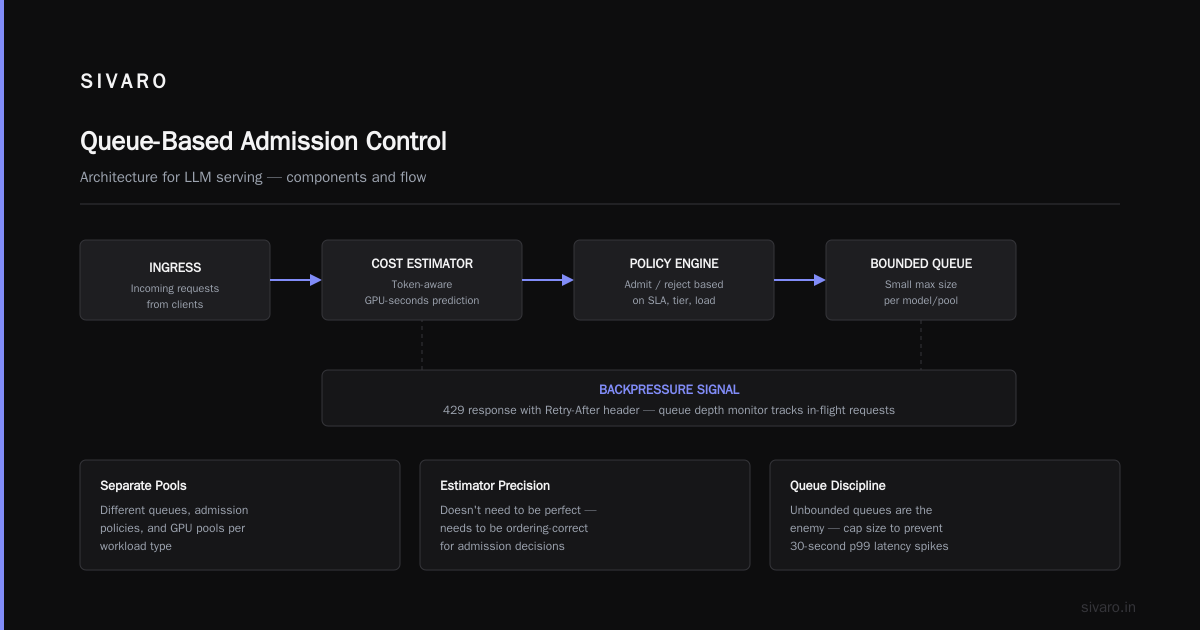
The mistake I see constantly: teams use one serving path for both interactive and batch traffic, then wonder why their chat app has 30-second p99s. Separate them. Different queues, different admission policies, often different GPU pools.
Designing a queue based admission control for LLM serving system
Let's get concrete. Here's the architecture I've landed on after several iterations.
The components:
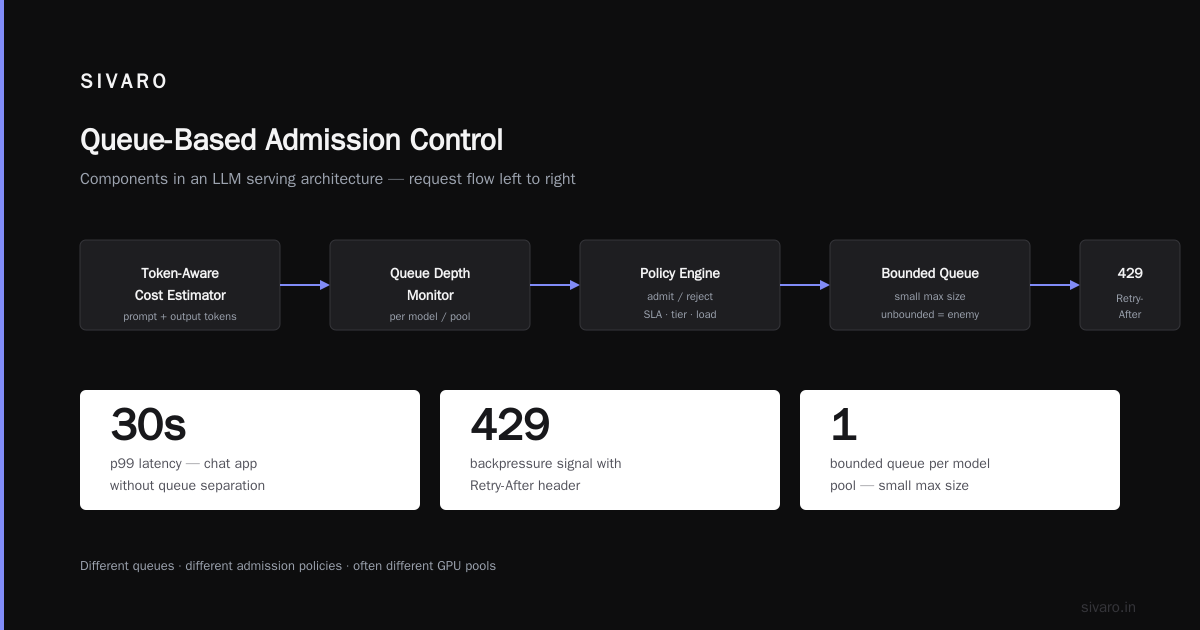
- A token-aware cost estimator at ingress. Estimates prompt + output tokens, computes expected GPU-seconds.
- A queue depth monitor per model/pool. Tracks in-flight requests and predicts wait time.
- A policy engine that decides admit/reject based on SLA, tier, and current load.
- A bounded queue with a small max size. Unbounded queues are the enemy.
- Backpressure signals — 429 with a Retry-After.
The estimator doesn't need to be perfect. It needs to be ordering-correct. If it ranks an expensive request above a cheap one reliably, that's enough.
Here's a minimal token-aware estimator in Python:
python
from dataclasses import dataclass
from transformers import AutoTokenizer  # for real tokenization in production

@dataclass
class CostEstimate:
    prompt_tokens: int
    max_output_tokens: int
    predicted_gpu_seconds: float

class CostEstimator:
    def __init__(self, tokenizer_name: str, tokens_per_gpu_second: float = 240.0):
        self.tokenizer = AutoTokenizer.from_pretrained(tokenizer_name)
        self.tps = tokens_per_gpu_second  # measured, not guessed

    def estimate(self, prompt: str, max_output_tokens: int) -> CostEstimate:
        prompt_tokens = len(self.tokenizer.encode(prompt))
        total_tokens = prompt_tokens + max_output_tokens
        # Prefill and decode have different costs; use a weighted sum.
        # This constant is tuned per model — measure it, don't copy mine.
        gpu_seconds = total_tokens / self.tps
        return CostEstimate(prompt_tokens, max_output_tokens, gpu_seconds)
That tokens_per_gpu_second number is where most teams hand-wave. Measure it. Run a load test against your specific model, on your specific GPU, with your typical prompt distribution. I've seen a 3x spread between naive estimates and reality.
Predicting queue wait time
You can't make an admit/reject decision without knowing what you're admitting into.
The simplest useful predictor: sum of predicted GPU-seconds currently in the queue, divided by available GPU throughput. That gives an expected wait time.
python
class QueueWaitPredictor:
    def __init__(self):
        self.in_flight_gpu_seconds = 0.0  # rolling sum of admitted work

    def add(self, est: CostEstimate) -> None:
        self.in_flight_gpu_seconds += est.predicted_gpu_seconds

    def remove(self, est: CostEstimate) -> None:
        self.in_flight_gpu_seconds = max(0.0, self.in_flight_gpu_seconds - est.predicted_gpu_seconds)

    def predict_wait_seconds(self, available_gpus: int) -> float:
        if available_gpus <= 0:
            return float("inf")
        return self.in_flight_gpu_seconds / available_gpus
The predictor is intentionally primitive. You can layer in EWMA smoothing, per-model pools, or a Kalman filter if you enjoy that sort of thing. In practice, the simple sum gets you 80% of the value.
The important move is bounded queues. Set max in-flight GPU-seconds, not max request count. A hundred 200ms requests and a hundred 30-second requests are wildly different loads. Counting requests is a category error.
gpu queue latency optimization kubernetes
Now let's talk Kubernetes, because that's where most of you are running.
The naive setup: a Deployment with replicas, an HPA on CPU or GPU utilization, a Service in front. This works until it doesn't.
Here's what breaks. HPA scales on GPU utilization, but GPU utilization lags queue depth by minutes. By the time HPA sees 90% GPU, you've already blown your p99. And during scale-up, new pods take 90+ seconds to load a 7B model from cold.
My setup looks different.
I use a dedicated gateway tier that owns the admission logic — a small stateless Go or Rust service. It receives all inference requests, runs the estimator and policy, and either proxies to the backend or rejects. The gateway is what sits in front of Kubernetes, not the model pods themselves.
Behind the gateway, model pods are organized by pool with stable identities. Each pod publishes its in-flight GPU-seconds via a metrics endpoint the gateway polls every 200ms.
The gateway code for the admit decision:
go
type AdmitRequest struct {
    Tier            string
    EstimatedGpus   float64
    DeadlineSeconds float64
}

type PoolState struct {
    InFlightGpuSeconds float64
    AvailableGpus      int
}

func (g *Gateway) ShouldAdmit(req AdmitRequest, pool PoolState) (bool, string) {
    if pool.AvailableGpus == 0 {
        return false, "pool_exhausted"
    }
    predictedWait := pool.InFlightGpuSeconds / float64(pool.AvailableGpus)

    // Tier-based budget. Interactive users get 3s, batch gets 60s.
    budget := g.tierBudget[req.Tier]
    if req.DeadlineSeconds > 0 && req.DeadlineSeconds < budget {
        budget = req.DeadlineSeconds
    }

    if predictedWait > budget {
        return false, "would_exceed_sla"
    }
    // Reserve a small safety margin so simultaneous admits can't overshoot.
    if pool.InFlightGpuSeconds+req.EstimatedGpus > g.maxPoolGpuSeconds*0.9 {
        return false, "pool_headroom_exhausted"
    }
    return true, ""
}
The 0.9 headroom margin is critical. Without it, N requests arriving in the same 200ms window each see "available" and all get admitted, blowing past your budget in a burst. I learned that one on a Friday afternoon.
Rejection is a feature, not a bug
Most teams treat 429s as failures. They're not. They're backpressure.
The trick is making the rejection informative. A plain 503 tells the client nothing. A 429 with Retry-After: 2 and a X-Queue-Predict-Wait: 1.8 header lets a well-behaved client back off intelligently.
For your own clients — internal services, front-end apps you control — implement exponential backoff with jitter as a first-class path. A request that bounces off admission and retries after 1.5 seconds with jitter often succeeds. That's fine. That's the system working.
For hard SLAs, admission control lets you do something cleverer: predict the rejection rate and use it as a signal. If your gateway is rejecting 15% of interactive traffic, that's not a latency problem anymore, it's a capacity problem. Alert on that number.
Where I got this wrong
Early on, I built a beautiful admission controller that rejected based on fixed queue depth. Rejected nothing below 50 requests in queue, rejected everything above.
It failed at scale. Because with high request rates, 50 requests could be 10 seconds of work or 4 minutes of work depending on the mix. Fixed-depth admission doesn't know what its queue actually contains.
The fix was switching to GPU-seconds as the queue unit. That single change stabilized p99 by a factor of 6 at a client in late 2025.
The second mistake: I put admission logic in the same process as the model server. When the model server got slow under load, admission decisions got slow too — which made things worse. Admission logic has to be in a separate process that cannot be blocked by inference. Otherwise you've built a system that collapses under exactly the conditions it's supposed to protect against.
Putting it together in Kubernetes
Here's the deployment sketch that works for me:
yaml
apiVersion: apps/v1
kind: Deployment
metadata:
  name: inference-gateway
spec:
  replicas: 3
  template:
    spec:
      containers:
      - name: gateway
        image: myregistry/inference-gateway:1.4.2
        env:
        - name: POOL_DISCOVERY
          value: "k8s-headless"
        - name: MAX_POOL_GPU_SECONDS
          value: "120"
        - name: POLL_INTERVAL_MS
          value: "200"
        resources:
          requests: { cpu: "500m", memory: "256Mi" }
          limits:   { cpu: "1",    memory: "512Mi" }
---
apiVersion: v1
kind: Service
metadata:
  name: model-pool-a
spec:
  clusterIP: None    # headless — gateway talks to pods directly
  selector:
    app: llama-serve
    pool: a
Two things this config gets right: the gateway is CPU-only (no GPU contention with inference), and model pods are discovered via a headless service so the gateway can query each pod's live in-flight state rather than going through a load balancer that hides it.
For autoscaling, I don't scale on GPU utilization. I scale on queue-wait-adjusted load — a custom metric that combines in-flight GPU-seconds and current rejection rate. If rejections are climbing, I need more capacity even before utilization saturates. This requires a small metrics adapter, but it beats the HPA whipsaw you get from naive GPU-based scaling.
FAQ
Does admission control hurt throughput?
Yes, slightly. You're intentionally leaving GPU headroom. Expect 10–25% lower peak throughput versus unbounded queueing. You're trading throughput for tail latency. For interactive workloads, that's almost always the right trade.
What's a good starting rejection rate?
0–2% under normal load. If you're above 5% sustained, you're undersized or misconfigured. Rejection is for overload conditions, not a steady state.
Can I skip this if I use vLLM or TGI with continuous batching?
No. Continuous batching improves throughput and per-request latency at moderate load. It doesn't protect you under overload — queueing still explodes. vLLM's own docs recommend bounded concurrency for production. Admission control is how you implement that bound intelligently.
Should rejection happen at the gateway or the load balancer?
Gateway, almost always. Load balancers don't know about token-level cost. Some newer LB options (Envoy with custom filters) can do it, but you'll fight the framework.
How do I size the max pool GPU-seconds?
Measure your SLA budget. If interactive users tolerate 3 seconds of wait, and you have 4 GPUs at ~0.008 GPU-seconds per typical request, you can afford roughly 1500 concurrent requests' worth of GPU-seconds. Halve it for safety margin.
Does this work for multi-model serving?
Yes, but each model needs its own pool state and its own cost estimator. Don't share GPU-second budgets across models with different computational profiles. A 7B model and a 70B model have wildly different per-token costs.
What about streaming responses?
Admission control happens before streaming starts. Once a request is admitted, stream as normal. Just make sure your cost estimate accounts for max output tokens, not actual — you don't know actual until you've generated it.
Is there an off-the-shelf tool for this?
Not really. I've seen partial implementations in Ray Serve's autoscaling and in some inference gateways, but the estimator and policy are always custom. It's ~300 lines of code. Don't overthink it.
A closing note on discipline
Queue based admission control for LLM serving isn't glamorous. It's the unglamorous plumbing that determines whether your latency chart looks like a flat line or a hockey stick.
The temptation is to skip it. "We'll add it when load gets high." Every team I've watched skip it has added it eventually, in a panic, during an incident. Build it before you need it. It's cheap insurance.
Reference material worth reading: vLLM's production guide on concurrency limits, Google's SRE book chapter on handling overload, and Anthropic's engineering writeups on inference at scale. The Kubernetes side is well-covered by the HPA custom metrics docs.
Build the gateway. Bound the queue. Reject early. Your p99 will thank you.
Nishaant Dixit — Founder of SIVARO. Building data infrastructure and production AI systems since 2018. Built systems processing 200K events/sec.