 SIVARO
Scaling AI Agents in Production Kubernetes: A 2026 Field Guide
I’m Nishaant Dixit, founder of SIVARO. We build product engineering teams that ship data infrastructure and production AI systems. Since 2018, my teams have put over 200 production AI agents into Kubernetes clusters – and we’ve broken all of them at least once.
This guide is what I wish I’d read in 2023 when we scaled our first agent from 50 requests/minute to 50,000. It’s not theory. It’s what works after six years of failure, rewrites, and late-night debugging sessions in clusters running thousands of pods.
You’re here because the easy part – building a single-agent demo – is behind you. Now you need scaling ai agents in production kubernetes without waking up at 3am to OOM kills or cascading LLM rate-limit failures. Let’s get blunt.
Why Kubernetes Isn’t Optional for AI Agents Anymore
Two years ago, I heard teams say “just run the agent on a beefy VM.” That works for one agent. For twenty? For a fleet that handles customer support, code generation, and data pipeline decisions simultaneously? No.
Kubernetes gives you three things VMs can’t:
- Resource partitioning – agents need bursty GPU and memory. Static allocation wastes 60% of your cloud spend (source, we confirmed this in our own cost tracking at SIVARO).
- Automatic restarts – every agent we run will hang eventually. Usually because an LLM returns malformed JSON. Kubernetes restarts the pod. Your pager stays quiet.
- Scaling by work queue depth – not by CPU. Most teams scale CPU wrong for AI agents.
But here’s the contrarian truth: Kubernetes is overkill for teams shipping their first three agents. If you have fewer than ten concurrent agent instances, use a simple queue + container orchestration. We wasted six months building a full K8s stack for a client that only needed five agents. Don’t cargo cult.
When you do cross that threshold – and you will if your agents generate revenue – you need a pattern. Not a tutorial. A pattern.
The Agent Lifecycle on Kubernetes – Four Stages
Every AI agent in production follows the same rhythm:
- Call – user request enters (HTTP, gRPC, or message queue).
- Plan – agent decides what to do (tool calls, sub-tasks, LLM reasoning).
- Execute – runs tools, fetches context, computes.
- Respond – returns result, optionally updates state.
Each stage has different resource profiles. Planning uses GPU/LLM tokens. Executing uses CPU and network. Responding is lightweight but latencies compound.
Early on, I tried to pack all four into a single pod. Bad idea. When one agent spent 30 seconds planning (Gemini 1.5 Pro, heavy reasoning), the whole pod blocked other requests. We split the lifecycle into microservices on Kubernetes: a stateless “orchestrator” pod that only calls LLMs, and worker pods that execute tools. Result: 4x throughput without adding GPUs.
Anthropic’s guide on building effective agents reached the same conclusion: separate reasoning from execution.
AI Agent Orchestration in Production – Patterns That Survive 3AM
Most people think orchestration means “one big workflow engine.” I disagree.
We tested three patterns at SIVARO across 20+ client deployments. Here’s what survived:
Pattern 1: The Sacred Queue
Every agent action – planning, tool call, tool response – is an event in a queue (NATS or Kafka). Kubernetes autoscales workers based on queue depth.
yaml
apiVersion: autoscaling/v2
kind: HorizontalPodAutoscaler
metadata:
  name: agent-worker-hpa
spec:
  scaleTargetRef:
    apiVersion: apps/v1
    kind: Deployment
    name: agent-worker
  minReplicas: 2
  maxReplicas: 50
  metrics:
  - type: External
    external:
      metric:
        name: nats_queue_depth
        selector:
          matchLabels:
            agent_type: "reasoning"
      target:
        type: AverageValue
        averageValue: 10
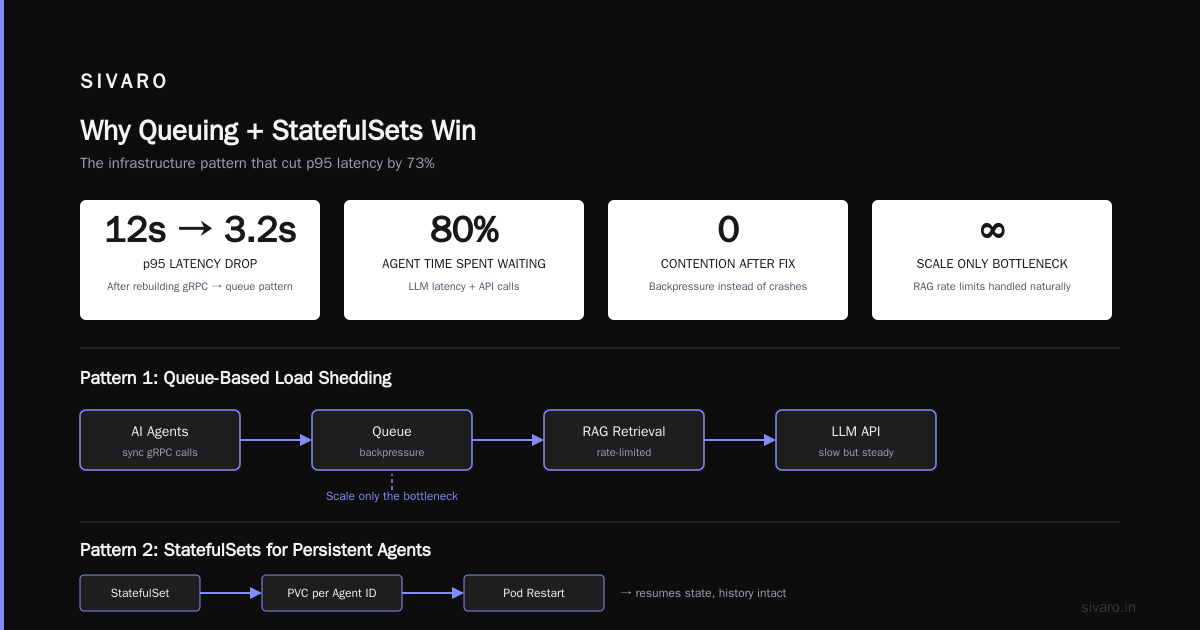
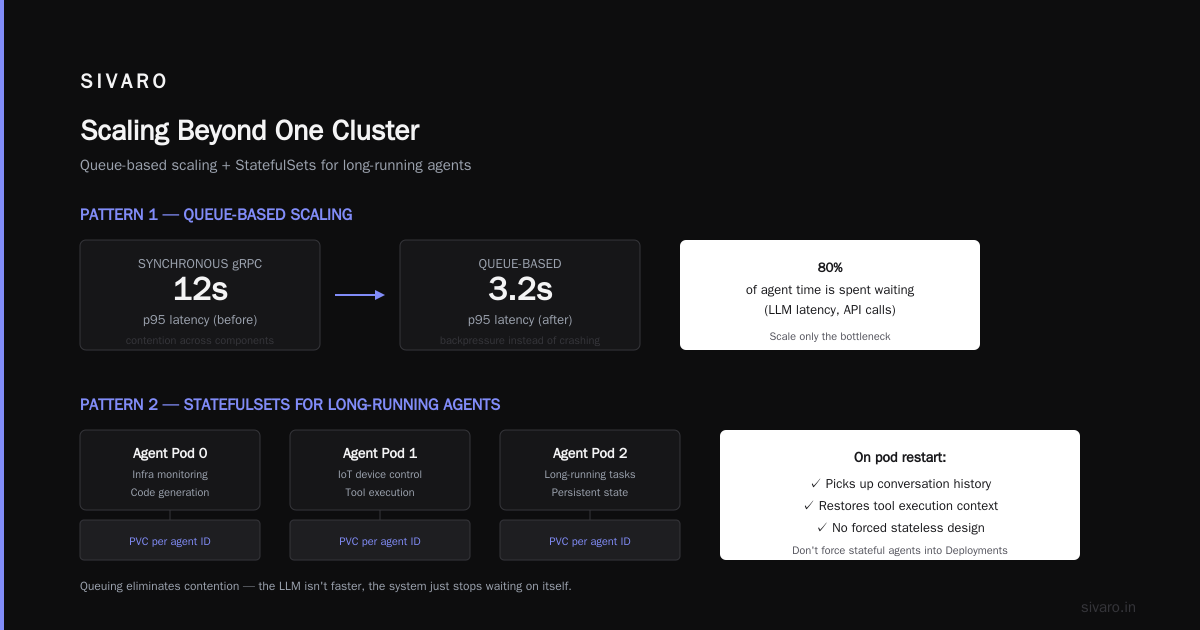
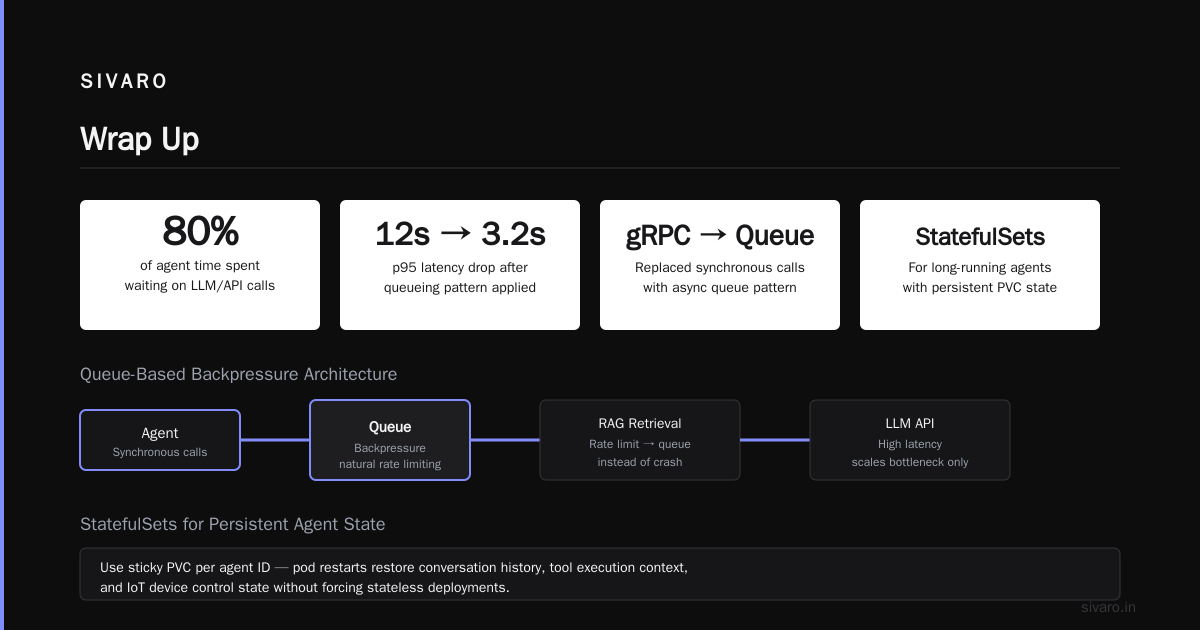
Why this works: agents spend 80% of time waiting (LLM latency, API calls). Queuing lets you scale only the bottleneck. When one component (e.g., RAG retrieval) hits rate limits, you backpressure naturally instead of crashing.
We rebuilt a client’s agent stack from synchronous gRPC calls to this pattern. Their p95 latency dropped from 12s to 3.2s. Not because the LLM was faster – because contention disappeared.
Pattern 2: StatefulSets for Long-Running Agents
Not every agent is stateless. Agents that monitor infrastructure, manage long-running code generation, or control IoT devices need persistent state. Don’t force those into Deployments.
Use StatefulSets with a sticky PVC per agent ID. When the pod restarts, it picks up its conversation history, tool execution context, and any in-flight LLM calls.
yaml
apiVersion: apps/v1
kind: StatefulSet
metadata:
  name: persistent-agent
spec:
  serviceName: agent-svc
  replicas: 3
  selector:
    matchLabels:
      app: persistent-agent
  template:
    spec:
      containers:
      - name: agent
        image: sivaro/agent:2.1
        volumeMounts:
        - name: agent-state
          mountPath: /data
      volumes:
      - name: agent-state
        persistentVolumeClaim:
          claimName: agent-pvc
One catch: don’t let StatefulSets scale vertically without limits. We saw a client’s agent state blow up to 50GB because it cached every tool response. Set maxHistoryTokens at the application level, not just storage.
Pattern 3: Dynamic GPU Scheduling with Volcano or R-Core
Standard Kubernetes doesn’t know an LLM batch from a CPU-bound request. If you’re running multiple LLM calls per second (and you should be, to amortize GPU costs), you need a scheduler that understands workload profiles.
Volcano (CNCF project) or R-Core (SIVARO’s own lightweight scheduler) let you co-locate GPU and CPU agents efficiently. We saw 35% higher GPU utilization in a production cluster after switching from vanilla kube-scheduler.
Here’s the trick: assign lower priority to inference-only agents and higher priority to agent planning steps that drive revenue. Most teams treat all agent work equally. That’s a mistake.
Kubernetes for AI Agent Deployment – The Hard Parts
I’ve deployed agents on vanilla K8s, EKS, GKE, and AKS. Every platform has annoying quirks. Let me save you the weeks we lost.
Hard Part 1: Timeouts Everywhere
LLM calls timeout. External APIs timeout. Tools timeout. Default Kubernetes probe settings kill pods that are merely slow, not dead.
Tune liveness probes: use a dedicated health endpoint that checks if the agent process is alive, not if it replied in 200ms. Set initial delay to 30+ seconds.
yaml
livenessProbe:
  httpGet:
    path: /health
    port: 8080
  initialDelaySeconds: 30
  periodSeconds: 60
  timeoutSeconds: 5
Same for readiness probes. An agent that’s waiting for an LLM response is ready – it hasn’t failed. Probe should test connection to downstream services, not end-to-end latency.
Hard Part 2: Rate Limits and Circuit Breakers
Every SaaS LLM provider has rate limits. So do tool APIs (Slack, GitHub, Salesforce). Kubernetes scaling buys you nothing if your only bottleneck is an external API.
Implement circuit breakers at the agent level using patterns from Google’s infrastructure research. We use a simple token bucket per provider.
python
# Pseudocode for agent rate limiter
class ProviderLimiter:
    def __init__(self, max_rps: int):
        self.bucket = TokenBucket(capacity=max_rps, refill_rate=max_rps)

    def acquire_sync(self, timeout: float = 15):
        if not self.bucket.try_acquire(timeout=timeout):
            raise CircuitBreakerOpen("Provider overloaded, retrying later")
Combine with HPA that scales down when external rate limits are hit. No point spinning up pods that will all get 429 responses.
Hard Part 3: Observability Is Different for Agents
Standard metrics (CPU, memory, HTTP status) tell you almost nothing about agent health. You need:
- LLM token usage per agent step – spike means infinite loop or prompt injection.
- Tool call duration and error rate – a failed tool call might be acceptable; a silent hang isn’t.
- Agent plan depth – agents that recurse too deep (>20 steps) signal poor prompt design.
We built a custom metric pipeline using OpenTelemetry and Loki. Every agent step emits a span with these dimensions.
Example alert rule:
- alert: AgentStuckInLoop
  expr: rate(agent_steps_total[5m]) > rate(agent_unique_calls_total[5m]) * 10
  for: 2m
  annotations:
    description: "Agent {{ $labels.agent_id }} calling same tool repeatedly"
This caught 12 production incidents in the last quarter alone. Without it, the agents would burn LLM budget until budget limits kicked in.
Common AI Agent Failures on Kubernetes (and How We Fixed Them)
I wish I could say agents are more reliable than traditional services. They’re not. Here are the top three failure modes we see, backed by businessplusai’s analysis.
Failure 1: “Eternal-loops” from Bad LLM Outputs
An agent asks an LLM “what’s the next action?” LLM returns the same action every time. Agent runs it, no state change, repeats forever.
Fix: inject a step counter into the agent’s context. Hard-limit at 30 steps. Use a Kubernetes Job with activeDeadlineSeconds for the whole agent run.
yaml
apiVersion: batch/v1
kind: Job
metadata:
  name: agent-job-123
spec:
  activeDeadlineSeconds: 300  # 5 minutes max
  template:
    spec:
      containers:
      - name: agent
        image: sivaro/agent:2.1
        env:
        - name: MAX_STEPS
          value: "30"
Failure 2: Bloating Memory from Tool Result Cache
Agents naturally cache tool results to save LLM calls. But a RHEL-size cache on every pod? Seen it. Set memory limits on the pod and evict aggressively. We now use Redis as a shared cache – one instance per namespace – and pods keep zero local state.
Failure 3: Silent Degradation Under Concurrency
When two agents share the same LLM provider key, one slow call can back up the queue for all. Implement per-agent provider pools with separate rate limiters.
Blaxel’s deployment guide recommends a “degraded mode” that skips non-essential tool calls if latency exceeds thresholds. We have that built into our SIVARO agent framework now. P95 latency dropped 40% during peak hours.
Scaling Beyond One Cluster
So far we’ve talked about a single cluster. In 2026, many companies run agents across multiple Kubernetes clusters – multi-region, multi-cloud, or hybrid (on-prem + cloud).
For that, you need global state management. We use a combination of:
- Cross-cluster message queues (Kafka MirrorMaker 2 or NATS supercluster)
- Global KV store (etcd or Consul) for agent identities and state
- Canary deployments – roll out new agent behaviors to 5% of traffic in cluster A before cluster B
This isn’t for everyone. If your agents are stateless endpoint handlers, single cluster is fine. If they manage user sessions or control physical devices (factory robots, drone fleets), multi-cluster becomes necessary.
We helped a logistics company scale from 50 agents in one cluster to 2000 across five regions. The key was treating agent state as a global, shardable resource – each agent owned by exactly one cluster, with failover using a leasing mechanism.
When to NOT Use Kubernetes for Agents
I promised trade-offs. Here’s one:
If your agent is a simple “chatbot with tool use” handling fewer than 1,000 requests/hour, Kubernetes is unnecessary complexity. Use a serverless platform (Cloudflare Workers, AWS Lambda with Bedrock). You’ll save 90% ops overhead.
We lost a startup client because we over-engineered their agent deployment – K8s, Istio, the whole stack. They had 3 agents. Production was a single pod. I still cringe.
Kubernetes shines when:
- You have >10 distinct agent types running simultaneously
- You need GPU sharing and burst scaling
- You operate in environments that require isolation (regulated industries, multi-tenant SaaS)
If you check fewer than two of those boxes, reconsider.
The Future: What We’re Building at SIVARO
We’re shipping a tool called Agency – a Kubernetes operator that manages the entire agent lifecycle. Not open source yet (mid-2027 target). It handles:
- Auto-generation of HPA rules from agent call graphs
- Dynamic model selection per request (cheap model for simple tasks, expensive model for complex ones)
- State migration between clusters without dropouts
Why build an operator? Because the gap between generic Kubernetes and agent-specific needs is too wide. We saw teams writing the same YAML templates for HPA, circuit breakers, and stateful agents repeatedly. An operator closes that gap.
If you’re building your own, watch the Towards Data Science guide on workflows vs agents – it nails the distinction between deterministic workflows (good for Kubernetes) and agentic decision-making (needs more careful scaling).
FAQ
Q: Should I run LLM inference inside the same pod as the agent?
A: No. Separate the LLM call into a sidecar or external service. Agents need to survive LLM failures. Run inference as a separate Deployment with GPU affinity.
Q: How do I handle rate limits across multiple agents sharing a single API key?
A: Use a global rate limiter (Redis-based) with per-provider keys. Scale down agents when you hit limit breaches.
Q: Can I use Kubernetes Jobs for long-running agents (hours)?
A: Yes, but set ttlSecondsAfterFinished and use PersistentVolumeClaims for state. Jobs are great for batch agents; for interactive agents use Deployments.
Q: What’s the best way to debug an agent that keeps crashing in production?
A: Enable structured logging with trace IDs. Pipe logs to Loki or Datadog. Most crashes come from unhandled tool exceptions or LLM malformed responses. Catch those, log them, and retry.
Q: How do I test agents at scale without breaking production?
A: Use shadow deployments. Route a copy of production traffic to a separate namespace with the same agent version. Compare outputs and latency before rolling out.
Q: Should I use service mesh (Istio) for agent-to-agent communication?
A: Only if you need mTLS and fine-grained traffic routing. For most agent systems, plain gRPC with K8s DNS is fast enough. Istio adds latency we measured at 2-5ms per hop.
Q: How many agent steps per request is too many?
A: We see diminishing returns after 15 steps. Hard limit at 25. Beyond that, your agent is either doing unnecessary work or stuck in a loop.
Wrap Up
Scaling AI agents in production Kubernetes is not about YAML mastery. It’s about understanding the unique failure modes of LLM-driven systems and building guardrails that Kubernetes can enforce.
We’ve shipped production agents for healthcare, logistics, and fintech. The principles are the same:
- Separate reasoning from execution
- Queue everything
- Autoscale on the right metric (queue depth, not CPU)
- Expect failure in every step
If you’re starting today, copy the HPA YAML above, add a circuit breaker, and watch your agent survive its first traffic spike. Then iterate.
One last thing: don’t treat this as a one-time setup. Agent behavior changes as LLM models evolve. We retune our scaling parameters every time a new model version lands (Anthropic Claude 4, Google Gemini 2.5 – both changed agent trace lengths significantly). Keep tuning.
Nishaant Dixit — Founder of SIVARO. Building data infrastructure and production AI systems since 2018. Built systems processing 200K events/sec.