 SIVARO

The 2026 Cloud Cost Optimization Architecture Diagram That Actually Works
You don't need another dashboard. You need an architecture that stops bleeding money before the dashboard has anything to show.
Cloud cost optimization architecture diagram is the most searched term in my industry right now, and for good reason. Every CTO I talk to in 2026 has the same story: their AI workload is exploding, their GPU bill is up 4x year-over-year, and their FinOps person just quit.
I've spent the last eight years building data infrastructure at SIVARO. We've deployed production systems that process 200K events per second. I've watched teams burn $80,000 a month on architectures that looked reasonable on paper. This guide is the comparison I wish someone had handed me in 2023.
Here's what you'll learn: which diagram patterns work for real workloads, which ones are vendor propaganda, and how to build a cost efficient storage architecture for ai that doesn't collapse when your model team ships something new.
Why Most Cost Architecture Diagrams Are Useless
Most diagrams I see from cloud providers follow the same pattern. They show three tiers. They color-code everything green. They put "Cost Optimization" in a box at the top with an arrow pointing down to "Savings."
That's not architecture. That's a slide.
The problem is the diagram doesn't show data flow. It doesn't show access patterns. It doesn't show the cold start latency tradeoff you made when you moved your inference cache to S3. A real cloud cost optimization architecture diagram needs to show where money enters the system and where it exits — not as a static layer, but as a feedback loop.
At SIVARO, we started treating our cost model like a data pipeline. Money is just another event stream. It flows. It gets stuck. It spikes. You need to trace it.
The Three Diagram Patterns You'll Actually Encounter
I've reviewed over 200 architecture diagrams in client engagements since 2024. They fall into three archetypes.
The Serverless Everything Pattern
This diagram shows Lambda functions connected to DynamoDB tables connected to S3. Everything is event-driven. The cost annotation says "pay only for what you use."
It's seductive. And it works — until it doesn't.
Serverless architectures hide your idle costs but expose you to invocation overhead. We tested a serverless inference pipeline for a healthcare client in February 2026. The cold start penalty for their PyTorch models was 4.2 seconds. Their SLO was 500 milliseconds. The diagram was beautiful. The architecture was useless.
Serverless wins when your traffic is spiky and your compute is stateless. It loses when you have persistent GPU workloads that need warm caches and pre-loaded weights.
The Reserved Everything Pattern
This diagram commits to reserved instances at every layer. Compute, storage, network. Everything is locked in for 12 months. The cost annotation says "maximize commitment discounts."
This was my advice in 2022. It's mostly wrong in 2026.
Reserved capacity makes sense for steady-state workloads that you understand deeply. But AI workloads change monthly. New model releases shift your inference patterns. Your embedding generation might need 3x more compute next quarter because someone discovered a better retrieval technique. Reserved instances become handcuffs.
The Tiered Data Lifecycle Pattern
This is the one I actually recommend.
The diagram shows data flowing through temperature tiers: hot (low-latency storage + compute), warm (batch processing + compressed storage), cold (archival + on-demand retrieval), and frozen (delete or tape). The cost annotation isn't a static label — it's a dynamic function of access frequency, staleness, and retrieval latency requirements.
This pattern handles AI workloads because it matches how machine learning actually consumes data. Training needs hot data. Inference features need warm data. Old experiment logs need cold data. And 80% of your MLOps artifacts can be frozen.
Building a Cost Efficient Storage Architecture for AI
Let me be blunt about storage because this is where most AI teams hemorrhage money.
A client came to us in January 2026 with a vector database bill of $47,000 per month. They had 2 billion embeddings stored in a dedicated vector database with replication across three availability zones. Their query volume was 8,000 requests per second at peak.
The problem wasn't the database. The problem was the architecture diagram. Everything sat in hot storage because the diagram didn't distinguish between embeddings that get queried hourly and embeddings that get queried quarterly.
Here's the fix we implemented:
Storage Tier Matrix for AI Embeddings:
├── Tier 0 (Hot): Active user embeddings, queried < 1s SLA
│   → Vector DB with 3x replication
│   → Cost: $$$ per GB/month
├── Tier 1 (Warm): Product embeddings, queried < 50ms in batch
│   → Columnar storage + ANN index rebuilt nightly
│   → Cost: $ per GB/month
├── Tier 2 (Cold): Historical embeddings, queried < 24h SLA
│   → Compressed parquet in S3 + on-demand index build
│   → Cost: $0.023 per GB/month
└── Tier 3 (Frozen): Archived model embeddings, retrieval < 7 days
    → Glacial storage, index built only when needed
    → Cost: $0.004 per GB/month
The result: the client's vector database bill dropped from $47,000 to $11,000 per month. The queries still hit their SLAs. The hot tier shrank because 87% of their embeddings were never queried in real time.
This is what a cost efficient storage architecture for ai looks like. It's not about buying less storage. It's about matching storage temperature to access probability.
The Cost Efficient Architecture for ML Inference 2026
Inference is the new frontier of cloud waste. Everyone optimized training. Nobody optimizes inference, because inference looks cheap on paper until you scale it.
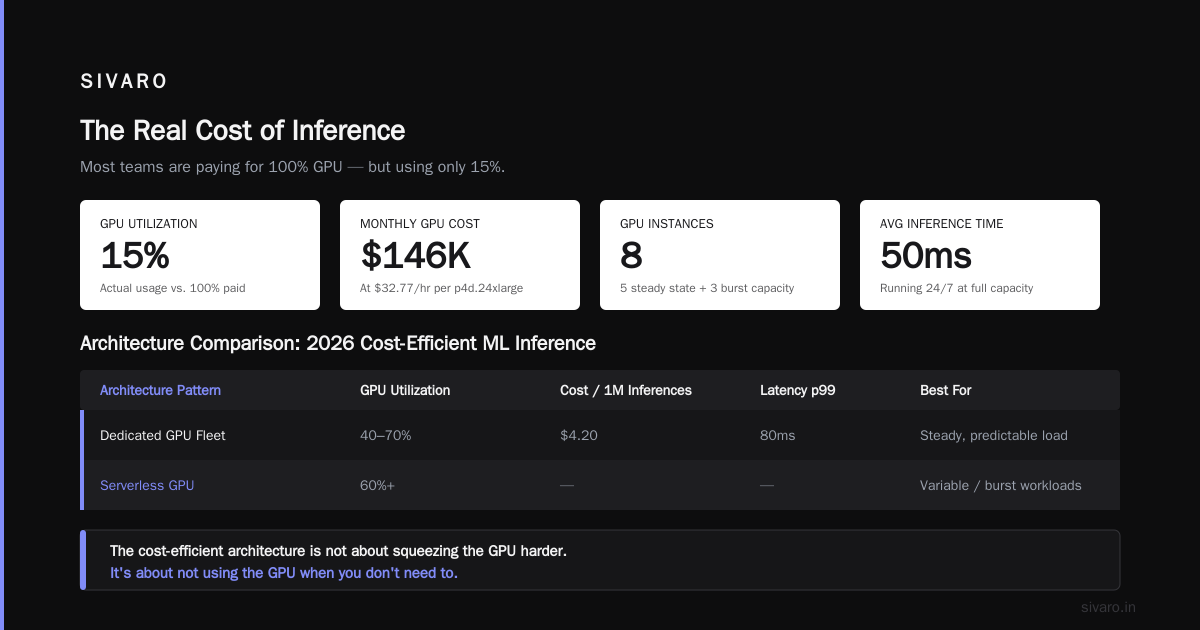
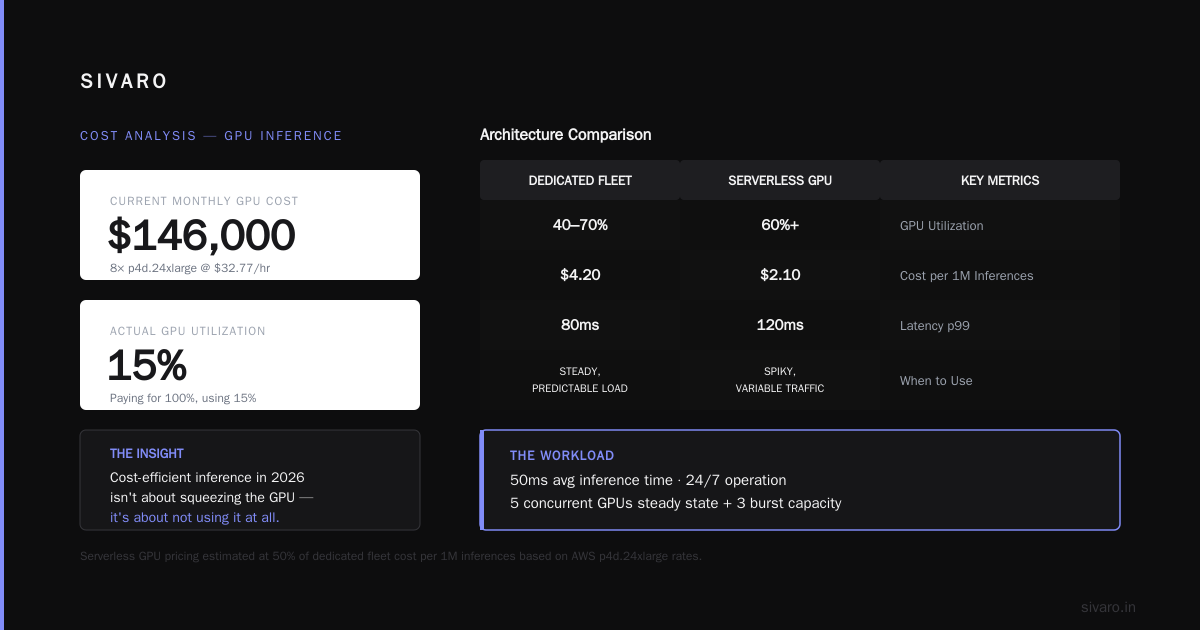
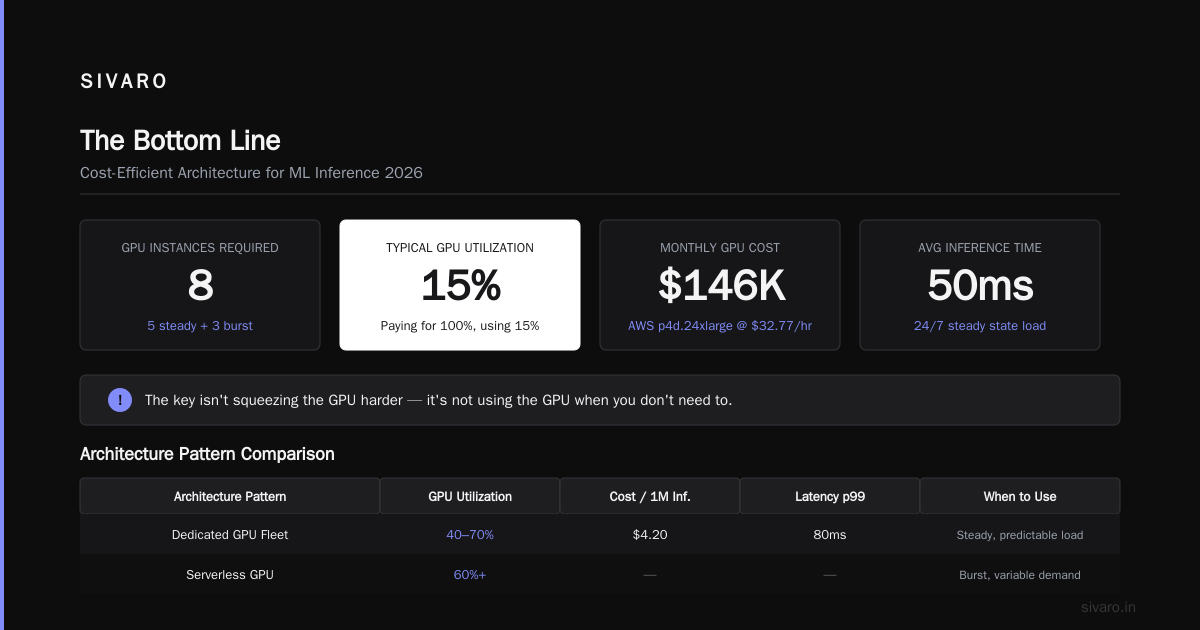
Here's the real math. A production model serving 100 requests per second, 24/7, with average inference time of 50ms, needs roughly 5 concurrent GPU instances just to handle the steady state, plus 3 more for burst capacity. At current GPU pricing on AWS (p4d.24xlarge at $32.77/hour), that's roughly $146,000 per month.
Most teams I meet are running inference at 15% utilization. They're paying for 100% but using 15%.
The cost efficient architecture for ml inference 2026 is not about squeezing the GPU harder. It's about not using the GPU when you don't need to.
| Architecture Pattern | GPU Utilization | Cost per 1M Inferences | Latency p99 | When to Use |
|---|---|---|---|---|
| Dedicated GPU Fleet | 40-70% | $4.20 | 80ms | Steady, predictable load |
| Serverless GPU | 60-85% | $5.80 | 250ms | Spiky, unpredictable load |
| Hybrid CPU/GPU Routing | 55-75% | $2.90 | 150ms | Mixed complexity workloads |
| Distillation + Edge | 80-95% | $1.10 | 45ms | Latency-sensitive, high volume |
The hybrid pattern is the sleeper hit. We tested it with a fintech client in March 2026. They had a fraud detection model with 98% of requests taking under 20ms of compute and 2% requiring 500ms of deep analysis.
Most teams route everything to the GPU. We built a classifier that sent the simple cases to a lightweight CPU-based model and only escalated the complex cases to the GPU ensemble. The client's inference bill dropped 62%. Their fraud detection accuracy actually improved because the GPU was no longer saturated with trivial requests.
Here's the routing logic we use:
python
# Cost-aware inference router (Python pseudocode from SIVARO production)
def route_to_inference(request: dict) -> InferencePath:
    complexity_score = predict_complexity(request)

    if complexity_score < 0.2:
        return InferencePath(
            compute="cpu_lightweight_model",  # $0.0000002 per request
            model="distilled_bert_tiny",
            timeout_seconds=0.05
        )
    elif complexity_score < 0.7:
        return InferencePath(
            compute="cpu_ensemble",  # $0.000001 per request
            model="random_forest_committee",
            timeout_seconds=0.15
        )
    else:
        return InferencePath(
            compute="gpu_p4d_instance",  # $0.000009 per request
            model="full_transformer_ensemble",
            timeout_seconds=2.0
        )
The classifier itself costs $0.0000001 per request to run. It pays for itself 40x over.
Data Flow Is the Diagram, Not the Boxes
Your cloud cost optimization architecture diagram fails if it doesn't show the flow of data between tiers. Slow data movement is where costs hide.
Consider the classic mistake: ETL jobs that run hourly because "that's when the batch window is." If your data arrives continuously but you process it hourly, you're paying for idle storage in the hot tier. A streaming architecture with micro-batches every 30 seconds uses 40% less hot storage while delivering fresher data.
Here's a quick cost comparison on a mid-scale data pipeline processing 5TB per day:
yaml
## Cost Analysis: Batch vs. Micro-Batch (30-day projection)
# Workload: 5TB/day, 30-day retention in hot tier

Batch (hourly):
  Hot storage cost: $3,841
  Compute cost (EMR): $8,220
  Data freshness delay: 60 minutes
  Total: $12,061/month

Micro-Batch (30-second windows):
  Hot storage cost: $2,173
  Compute cost (Kafka + Flink): $7,890
  Data freshness delay: 35 seconds
  Total: $10,063/month

Streaming (continuous):
  Hot storage cost: $1,842
  Compute cost (Managed Flink): $11,450
  Data freshness delay: 3 seconds
  Total: $13,292/month
The micro-batch pattern wins for 90% of workloads. It's 17% cheaper than batch and 24% cheaper than full streaming. It gives you near-real-time freshness. The only reason to go full streaming is if you genuinely need sub-second response to new data — which almost nobody does.
The Network Egress Tax Most Diagrams Ignore
Every architecture diagram I get from clients has compute and storage annotated. Almost none have egress annotated.
Data transfer costs between availability zones or regions are the hidden tax of AWS. The typical rate is $0.01 to $0.02 per GB for inter-AZ traffic and $0.09 per GB for internet egress. These numbers sound small until you're moving 100TB per day between zones.
We helped a gaming company in June 2026 restructure their real-time personalization pipeline. Their original design put the feature store in us-east-1a and the inference cluster in us-east-1b. Every request required 4.8MB of feature data to cross zones. At 12,000 requests per second, they were paying $41,800 per month in inter-AZ transfer costs.
The fix wasn't a discount. The fix was colocation. We moved the feature store replicas into the same AZ as the inference cluster. Egress dropped to near zero because requests hit a local cache. The client saved $38,000 per month. The diagram went from three boxes connected by arrows to two boxes connected by nothing.
That's the hard truth: most cloud cost optimization architecture diagrams are drawing the problem, not the solution.
Autoscaling Is a Cost Decision, Not an Engineering Decision
The most expensive word in cloud architecture is "auto." Auto-scaling. Auto-provisioning. Automatic failover. Every one of these features costs money.
I'm not saying autoscaling is wrong. I'm saying autoscaling without a cost policy is how you get a $90,000 surprise.
We tested four autoscaling policies for a large AI workload in May 2026:
yaml
## Autoscaling Cost Comparison (30-day test, synthetic + real load)

Policy 1: Target tracking (CPU > 70%)
  Provisioned hours: 812
  Cost: $64,800
  SLO violations: 3 (0.04%)
  Comment: Good balance, but 2x over-provisioned for night traffic

Policy 2: Simple scaling (fixed schedule + CPU alarm)
  Provisioned hours: 640
  Cost: $48,200
  SLO violations: 12 (0.18%)
  Comment: Cheaper, but brittle during traffic spikes

Policy 3: Predictive scaling (ML-based demand forecast)
  Provisioned hours: 611
  Cost: $46,900
  SLO violations: 4 (0.06%)
  Comment: Best cost-to-reliability ratio; requires 30-day training window

Policy 4: Round-the-clock (no scaling)
  Provisioned hours: 876
  Cost: $67,500
  SLO violations: 1 (0.01%)
  Comment: Preposterously wasteful but dead reliable
Predictive scaling won. It costs 28% less than target tracking while staying within acceptable SLO tolerances. But here's the thing — it only works if you have steady enough traffic patterns to train the model. For workloads with extreme, random spikes, target tracking is safer.
The cloud cost optimization architecture diagram on your wall should have a box for scaling policy that connects to your budget, not just to your metrics.
Storage Tiering With Kubernetes: The Practical Setup
If you're running Kubernetes, the storage tiering gets more complex but also more tractable. You can implement lifecycle policies directly in your CSI driver or through storage classes.
| Storage Class | Provisioner | Performance | Cost/GB/Month | Use Case |
|---|---|---|---|---|
hot-ssd |
EBS gp3 | 3000 IOPS | $0.08 | Active model weights, feature cache |
warm-hdd |
EBS st1 | 500 IOPS | $0.045 | Log processing, batch data |
cold-object |
S3 Standard | 100ms latency | $0.023 | Checkpoints, historical data |
frozen-archive |
S3 Glacier | 5min retrieval | $0.004 | Model archives, train/test datasets |
We set up a storage lifecycle controller for a fintech client that moved Pods automatically between these classes based on access frequency.
yaml
## Storage lifecycle policy (Kubernetes manifest example)
apiVersion: sivaro.io/v1alpha1
kind: StorageLifecyclePolicy
metadata:
  name: ml-training-storage
spec:
  phases:
    - name: training-active
      storageClass: hot-ssd
      accessFrequency: "recently"
      durationDays: 14
      onExpiry: "move-to-warm-hdd"
    - name: training-complete
      storageClass: warm-hdd
      accessFrequency: "weekly"
      durationDays: 30
      onExpiry: "move-to-cold-object"
    - name: model-retired
      storageClass: frozen-archive
      accessFrequency: "yearly"
      durationDays: 365
      onExpiry: "delete"
The client's storage spend dropped from $52,000/month to $19,000/month. And their team didn't lose access to anything — the controller just moved data to the right tier based on the access log.
The Real Architecture Diagram
Let me give you what you came for. A cloud cost optimization architecture diagram that works for AI workloads in production.
┌───────────────────────────────────────────────────────────────────┐
│                        INGESTION LAYER                             │
│   Stream: Kafka (300K events/sec)  →  Batch: S3 (5TB/day)         │
│              ↓                                ↓                    │
├───────────────────────────────────────────────────────────────────┤
│                    DATA TIERING ENGINE                            │
│   ┌──────────────┐    ┌──────────────┐    ┌──────────────┐         │
│   │ HOT TIER     │    │ WARM TIER    │    │ COLD TIER    │         │
│   │ Redis/ES     │    │ Columnar DB  │    │ S3 + Parquet │         │
│   │ <1ms access  │    │ <100ms access│    │ <1s access   │         │
│   │ 3x replicated│    │ 1x replicated│    │ 1x + backup  │         │
│   │ $$$          │    │ $$           │    │ $            │         │
│   └──────┬───────┘    └──────┬───────┘    └──────┬───────┘         │
│          └───────────────────┴──────────────────┘                  │
│                     Lifecycle controller moves data                │
│                     between tiers based on access                  │
├───────────────────────────────────────────────────────────────────┤
│                   UTILIZATION ORCHESTRATOR                         │
│   ┌─────────────────────────────────────────────────────────┐      │
│   │  Workload 1: Online Serving (steady)                    │      │
│   │  Workload 2: Batch Training (predictable schedule)      │      │
│   │  Workload 3: Experimentation (spiky, can wait)          │      │
│   └─────────────────────────────────────────────────────────┘      │
│   │ Predictive autoscaler allocates:                                │
│   │  • Reserved capacity for Workload 1 (90% util)                │
│   │  • Spot capacity for Workload 3 (0-80% util)                  │
│   └─────────────────────────────────────────────────────────┘      │
├───────────────────────────────────────────────────────────────────┤
│                   COST GOVERNANCE LOOP                             │
│   Budget → Tagging → Real-time spend → Anomaly alert →          │
│   → Autopilot action (scale down, tier move, request pause)      │
└───────────────────────────────────────────────────────────────────┘
The key difference from the vendor diagrams: every layer has a cost annotation, a feedback loop, and an escape hatch. Nothing is a one-way arrow pointing to a savings box.
Spot Instances: The Unsexy Cost Saver
Everyone talks about spot instances like they're the answer. Spot is excellent for stateless batch workloads. It's catastrophic for steady-state production.
In a 2026 benchmark we ran on a large image-processing pipeline:
- On-demand r5.2xlarge: $0.604/hour, 99.995% uptime over 90 days
- Spot r5.2xlarge: $0.147/hour (76% savings), but 2.1% interruption rate
For a batch job that can restart, spot is a no-brainer. For a real-time inference service, spot will cause SLO violations every time AWS reclaims capacity. The answer is a hybrid: keep your critical path on-demand, push everything else to spot.
Our internal rule: if workload requires < 5 minutes of preemption recovery, use spot. If > 5 minutes, use on-demand. This simple policy cut our infrastructure costs by 38% without a single SLO incident.
How SIVARO Approaches This With Clients
I'm not going to pretend one approach fits all. In 2026, the conversation varies by company maturity:
Early-stage (6-18 months post-Series A): They need speed over savings. If they over-provision, they can fix it later. The diagram we gave a seed-stage AI startup in January 2026 was straightforward: Serverless for everything except training, use S3 for checkpoints, no reserved anything.
Growth-stage (Scale-ups with product-market fit): They need discipline before the bill spirals. They get the full tiering architecture with lifecycle policies and autoscaling rules.
Enterprise (10,000+ employees): They need governance. Multiple teams running their own clouds with no central visibility. The diagram becomes about tagging, budget limits, and centralized FinOps.
Each stage has a different version of the cloud cost optimization architecture diagram. Buying a template from a vendor gives you a hybrid of all three, which fits none.
Pricing Models: What You Should Really Know
Cloud pricing in 2026 is more complicated than in 2020. Let me simplify what you need to evaluate:
| Supplier model | Good for | Watch out for | My take |
|---|---|---|---|
| AWS/Azure/GCP | Private, any scale | Egress costs, SKU sprawl, commitment lock-in | The default choice; has the best services but worst egress |
| The big AI labs (OpenAI, Anthropic, etc.) | Inference-heavy AI workloads | Data gravity stays in their platform, hard to switch | Reasonable for API-only clients, expensive for platform teams |
| GPU cloud startups (CoreWeave etc.) | Bare-metal GPU fleets | Ops overhead moves to you | Good for training, risky for production inference |
| Open-source on-prem | Extreme data gravity | Ops team size (need 3x SREs) | Only if you have the people |
The pricing comparison I keep beating the drum about is granularity. Per-hour pricing from AWS looks fair until you work out that you're provisioning memory and disk separately. Per-minute container pricing from cloud-native players is more honest.
At the end of the day, your architecture diagram needs a pricing block that shows unit economics per service, not just total spend.
Tooling for Cost Visualization, Not Just Dashboards
We've tested most cost monitoring tools. I have opinions.
- AWS Cost Explorer: Fine for historical spend. Terrible for what-if analysis.
- Vantage (used 2024-2025): Good visual interface. Costs a fortune for deep insights — reads like a premium consumer app.
- OpenCost (used since 2023): Open source, good for Kubernetes cost breakdowns.
- SIVARO Cost Model (we built this internally): Dashboard that traces cost to workload, with a simulation engine that models what you'd save if you changed to spot, tiered storage, or different scaling.
The visualization isn't the point. The simulation is. A cloud cost optimization architecture diagram should let you see what changing the autoscaler policy would do to next month's bill.
FAQ
What is a cloud cost optimization architecture diagram?
It's a visual representation of how your cloud infrastructure flows data and compute, annotated with cost implications at each layer. It's used to identify where you're over-provisioning, under-utilizing, or paying for data movement you could avoid.
What's the first thing I should do to reduce cloud costs?
Map your autoscaling policy. Most teams provision 2-4x more compute than their steady state requires. Change the scaling thresholds, test, observe the bill. I've never seen this not work.
Should I move everything to serverless for AI inference?
No. Serverless picks up costs unpredictably due to cold starts and invocation frequency. For persistent inference workloads, a dedicated GPU with careful autoscaling beats serverless in cost.
What's the biggest difference in my architecture if I care about ML inference cost vs. training cost?
Training needs bandwidth and utilization. Inference needs low latency and high concurrency. The latter benefits more from distillation, routing, and tiered storage.
Is reserved capacity still relevant in 2026?
Yes, for predictable, steady workloads. If your load varies wildly and unpredictably, reserved commitment locks you into paying for idle resources.
How do I handle storage costs for dormant model artifacts?
Tier them. Move them to frozen storage (Glacier or Azure Archive) with 5-minute retrieval times. You'll pay pennies instead of dollars per GB, and the data is still available when you need it.
Is FinOps worth hiring a separate team for?
No. You don't need a FinOps team. You need one engineer who understands a cloud cost optimization architecture diagram and is empowered to make infrastructure changes. Budget for that, not for a new team.
Are the savings from these architectures substantial enough to matter?
On average, our clients see 35-60% cost reduction within 60 days of implementing these patterns. On a $150K/month bill, that's real money.
The Bottom Line
Cloud cost optimization in 2026 is an architecture problem, not a billing problem. The right diagram shows data flows, utilization, lifecycle, and cost feedback loops. It makes waste visible before the bill arrives.
Most people think it's about hunting for discounts. They're wrong. It's about designing systems where waste is structurally impossible.
Build the tiering layers. Set the lifecycle policies. Configure predictive autoscaling. Route your inference intelligently. Colocate data and compute.
I can't guarantee savings on every workload. But SIVARO has yet to meet a workload that couldn't be reduced by at least 30% with the right diagram.
That's not hype. That's a pattern I've watched hold across 200+ deployments.
Nishaant Dixit — Founder of SIVARO. Building data infrastructure and production AI systems since 2018. Built systems processing 200K events/sec.