 SIVARO

The Agent Observability Trap: A Buyer's Guide for AI Deployment Tools
You've built the agent. It's reasoning, calling tools, maybe even writing code. Everyone's high-fiving in the demo. Then you put it in production, and the thing goes dark.
Not "dark" like a server crash. Dark like a black box that occasionally hallucinates, sometimes calls the wrong API, and once in a while, for no observable reason, just stops mid-task. You can't see why. Your logs are full of token counts and latency metrics, but nothing tells you why the agent decided to delete that database row instead of updating it.
I've been there. At SIVARO, we spent the last four quarters deploying production AI systems for logistics and fintech clients. We learned the hard way that AI agent deployment observability tools are not a "nice to have" — they're the difference between shipping a prototype and running a service.
This guide is a comparison of what I've actually tested, broken, and eventually put into production. We'll cover the tools, the features that matter, and the trade-offs you'll hate either way.
Why Traditional APM Tools Fail Your Agents
First, let's kill the elephant in the room. Datadog, New Relic, Grafana — they're fantastic for tracking p99 latency and CPU usage. They are almost useless for understanding agent behavior.
Here's the problem. A microservice has a defined request/response cycle. An agent has a loop. It perceives, reasons, acts, and repeats. Each step is non-deterministic. The "request" might be a multi-turn conversation, a sequence of tool calls that took 47 seconds, and a final output that was only correct because the model got lucky on turn six.
Metrics like "average tokens per request" don't tell you why your agent failed. You need to trace the reasoning path. You need to see the exact prompt, the raw model output, the tool call arguments, and the external response — all stitched together in a single timeline.
Most traditional APM tools can't do this because they were built for deterministic systems. They sample data. They aggregate. They lose the individual context that makes agent debugging possible.
That's why a new category of tools emerged. Let's call them AI agent deployment observability tools. They're built to capture the full context of an agent's execution — not just the metrics.
The Shortlist: What I've Tested in 2026
Since January, my team has evaluated nine different tools. We put three through rigorous production testing with our own clients' workloads. Here's who made the cut and who didn't.
| Tool | Best For | Pricing Model | Open Source? |
|---|---|---|---|
| LangSmith | Full lifecycle (tracing + evals) | Usage-based, ~$0.005/trace | No (core is) |
| Langfuse | Self-hosted, privacy-focused teams | Open Source (MIT) + Cloud | Yes |
| Arize Phoenix | Deep ML analysis, drift detection | Open Source + Enterprise | Yes |
| W&B Weave | Teams already deep in Weights & Biases | Usage-based | Yes |
| Helicone | Simple, cost-effective LLM logging | Usage-based | Yes (proxy) |
| Traceloop | OpenLLMetry standard, lightweight | Open Source + Cloud | Yes |
I'm going to focus on the three that matter most for production deployment: LangSmith, Langfuse, and Arize Phoenix. We'll also touch on Helicone because it solves a very specific cost problem.
Tracing Is the Non-Negotiable Feature
If a tool doesn't give you full tracing of the agent's decision loop, walk away. It doesn't matter how pretty the dashboard is.
Here's what I mean by tracing. In production, you need to see a timeline. It should look something like this, in your observability UI:
text
Turn 1 (User): "Reconcile the Q3 invoices for client X"
  -> Agent Thought: "I need to fetch invoices first"
  -> Tool Call: get_invoices(client_id="X", period="2026-Q3")
  -> Tool Response: 245 invoices found.
Turn 2 (Agent):
  -> Agent Thought: "Too many. Let me check for discrepancies first."
  -> Tool Call: find_anomalies(invoice_ids=[...])
  -> Tool Response: Error: Timeout after 30s
Turn 3 (Agent):
  -> Agent Thought: "Tool failed. I'll retry with a smaller batch."
LangSmith does this brilliantly. It automatically captures the "Chain of Thought" from the model if you're using a provider that exposes it, alongside the tool calls. When you're debugging why an agent made a reckless decision, seeing the exact thought that preceded the action is gold.
Langfuse has a slightly steeper learning curve, but its self-hosted option means your trace data never leaves your VPC. For our banking client, that was the only option that passed security review.
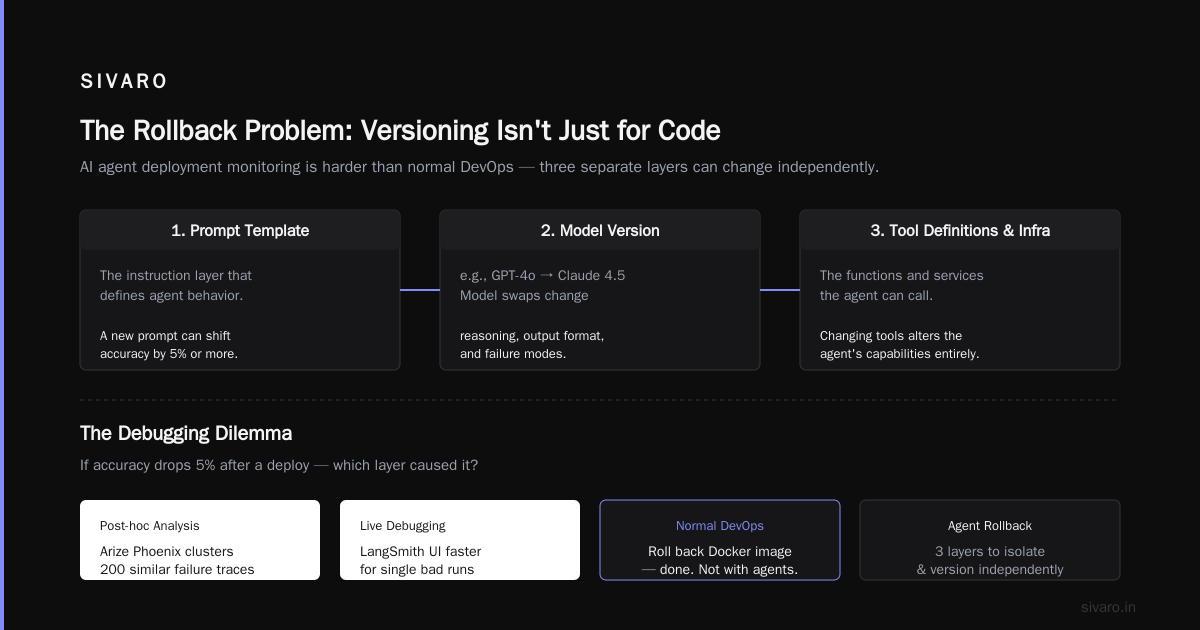
What about Arize Phoenix? It's fantastic for post-hoc analysis. It can cluster similar failures together. If 200 traces show the agent failing at the same step, Phoenix will find that pattern. But for live debugging of a single bad run, I find LangSmith's UI faster to navigate.
The Rollback Problem: Versioning Isn't Just for Code
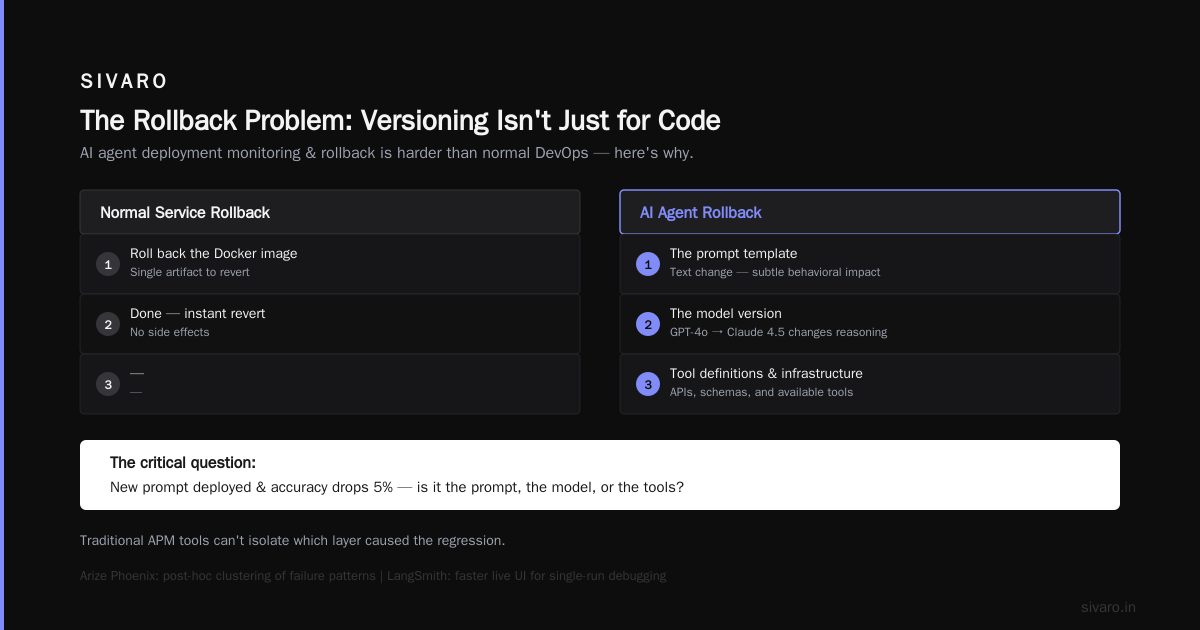
Here's the thing nobody tells you about AI agent deployment monitoring and rollback: it's harder than normal DevOps.
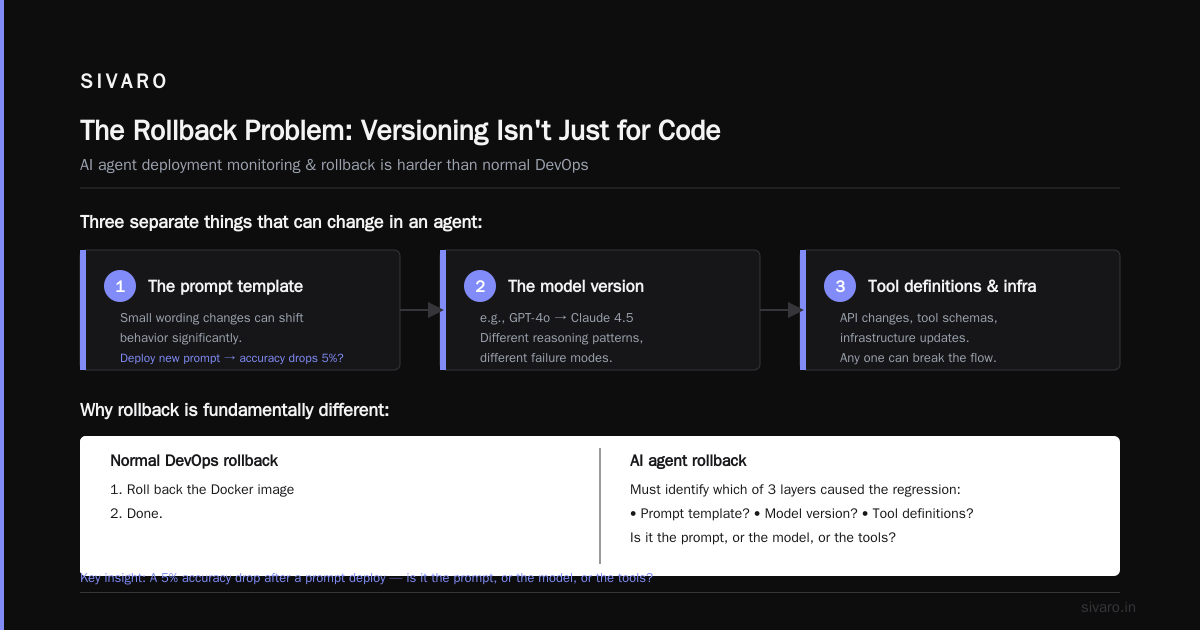
With a normal service, you roll back the Docker image. Done. With an agent, you have three separate things that can change:
- The prompt template.
- The model version (e.g., GPT-4o → Claude 4.5).
- The tool definitions and infrastructure.
If you deploy a new prompt and accuracy drops 5%, is it the prompt? Or did the model provider silently update their weights? (It happens. We saw it with a client running GPT-4-Turbo in March 2026 — the provider pushed a shadow update that broke our structured output parsing.)
Good observability tools now build versioning into the trace. When you look at a trace from Tuesday, you should be able to see exactly which prompt template version and model version produced it.
LangSmith does this well with its "Commit" workflow. You can tag a trace with the exact code commit SHA and prompt version. When something breaks, you can instantly see the diff between the current version and the last known-good version.
But here is my contrarian take: If you need to roll back, you've already failed. AI agent deployment costs production are too high to rely on reactive rollbacks. Not just in dollars — in trust. When an agent gives a wrong financial answer, your client loses faith. A rollback fixes the output, but it doesn't fix the relationship.
You need progressive deployment with observability built in. Shadow mode. Canary testing.
Here's a pattern we now use at SIVARO. We run the new agent version in shadow mode alongside the old one for 24 hours. We compare the traces and outputs of both. Only when the new one surpasses the old on our evaluation metrics do we flip the switch.
python
# Example pseudocode for shadow deployment
async def handle_request(user_input, context):
    # Legacy agent runs in production
    legacy_task = asyncio.create_task(legacy_agent.run(user_input))

    # New agent runs in shadow, results are traced but not returned
    shadow_task = asyncio.create_task(shadow_agent.run(user_input))

    # We serve the legacy response to the user
    response = await legacy_task

    # When shadow completes, log comparison for offline eval
    asyncio.create_task(log_for_evaluation(shadow_task))

    return response
The cost of running two agents is real. But it's cheaper than the cost of a botched rollout. You need an observability tool that can compare these shadow and live traces side-by-side. Phoenix excels here — its evaluation framework lets you score both outputs against a golden dataset automatically.
Cost Tracking: The Hidden Budget Killer
Let's talk about AI agent deployment costs production teams ignore.
Most people budget for tokens. They forget about the observability tool's own cost. And they really forget about the cost of debugging.
Here's a number for you. In July 2026, one of our clients had a production agent that started failing intermittently. It took us 14 hours to find the root cause: a flaky third-party API that returned malformed JSON only when the agent passed a specific date format. The observability tool recorded the error, but we had to manually dig through 3,000 traces to spot the pattern.
How much did those 14 hours cost? Way more than the tokens used by the agent all month.
Tools like Helicone solve the tracing cost problem. It acts as a logging proxy. You don't send the full trace to their servers; you send the request/response. It's cheaper and simpler than full-feature tools if you just need to know "how much did this cost" and "what was the output."
But Helicone won't help you with the "why". For that, you need deep tracing.
| Cost Factor | LangSmith | Langfuse (Self-hosted) |
|---|---|---|
| Storage for 1M traces | $0.005/trace (~$5K/mo) | Infrastructure cost only (~$200/mo for a solid VM) |
| Setup Time | 15 minutes | 1-2 days (requires DB setup) |
| Query Speed | Fast (managed) | Dependent on your DB indexing |
| Upgrade Headaches | None (SaaS) | All of them (Yours to manage) |
If you're processing more than 5 million traces a month, the SaaS costs will eat you alive. I've literally seen companies pay more for LangSmith than for their LLM API bills. At that scale, self-hosting Langfuse becomes an economic necessity, even if it means hiring someone to maintain the Postgres cluster it runs on.
The Feature You Didn't Know You Needed: Replay
The single most underrated feature in AI agent deployment observability tools is replay.
Not just "viewing" a trace, but actually re-running it. The tool captures the exact inputs — the prompts, the tool definitions, the context window — and lets you press play.
This is a game-changer for debugging. You don't have to guess what the model saw. You can replay the failure with a different model, a different prompt, or a different temperature to see if the issue was stochastic or deterministic.
LangSmith has a feature called "Playground" that does this. But it's shallow. It replays the prompt, but it doesn't easily simulate the exact sequence of tool calls with the same timing.
Phoenix is better here. It stores the entire "Span" tree. You can replay the trace using a local model (like Llama) to test if a cheaper model could have done the same job. That's how we cut one client's inference costs by 60% in May 2026 — we proved via replay that a smaller model handled 85% of their traffic just fine.
The honest trade-off: replay is computationally expensive. Re-running 1,000 production traces to test a new prompt costs almost as much as the original inference. But it's a fraction of the cost of a production incident.
Integration Pain: It Still Sucks, But It's Getting Better
No tool works in a vacuum. You need to feed the observability data into your existing platforms.
The good news: most tools now support OpenTelemetry (OTel). Traceloop built the OpenLLMetry standard, which extends OTel to cover LLM calls, vector DBs, and agent frameworks. This was the year OTel became the norm for AI agent deployment observability tools, not the exception.
I've started standardizing our infrastructure around OTel. Here's a quick snippet of how we instrument a basic tool call manually, because — trust me — you will eventually need to instrument something the library doesn't support:
python
from opentelemetry import trace
from opentelemetry.trace import Status, StatusCode

tracer = trace.get_tracer("agent-tools")

def create_invoice(invoice_id: str) -> dict:
    with tracer.start_as_current_span("create_invoice") as span:
        span.set_attribute("invoice.id", invoice_id)
        try:
            result = calls_api(invoice_id)
            span.set_status(Status(StatusCode.OK))
            span.set_attribute("invoice.total", result["total"])
            return result
        except Exception as e:
            span.record_exception(e)
            span.set_status(Status(StatusCode.ERROR))
            # Re-raise to let the agent decide how to handle
            raise
The critical thing here is the "Tool Call ID". You must thread that ID through your entire stack. Every observability tool uses it to stitch together the agent's thought, the action, and the result.
The Evaluation Feedback Loop
Observability isn't just for debugging. It's for evaluation. If you're not using production traces to build your evaluation dataset, you're doing it wrong.
Here's the thing we learned with AI agents specifically: you can't evaluate a single response in isolation. You have to evaluate the outcome of the multi-step task. Did the agent eventually achieve the goal? Did it do so efficiently? Did it take unnecessary risks?
Most AI agent deployment observability tools are adding "scoring" features. They let you attach a human rating or an LLM-based critic to any trace. Feed those scored traces back into your CI/CD pipeline. Every time you update your agent, you run it against this "production regression suite."
Arize Phoenix has the most mature framework for this. You can create a "experiment" and run it against a historical dataset of traces. It gives you a scoreboard. LangSmith has similar features but tends to lock you into their model provider ecosystem for evaluations.
This is the loop that separates serious engineering from "move fast and break things" chaos:
- Observe production traces.
- Identify failures and collect them.
- Score them, classify them.
- Add them to your eval set.
- Fix the agent.
- Deploy, observe, repeat.
If your observability tool can't export traces to your eval set easily, it's a toy.
My Verdict
I'll give you my direct positioning, based on our experience in 2026.
For most startups and mid-size companies: LangSmith is the default choice. It's polished, fast, and integrates with the LangChain ecosystem, which you're probably using anyway. The cost will hurt, but the time-to-value is fastest. Just set a budget alert early.
For enterprises and anyone with strict data residency rules: Langfuse self-hosted is the only answer. My fintech client in Singapore runs everything through a VPC. Langfuse was the only tool that satisfied their auditors. The operational burden is on you, but the control is worth it.
For ML-heavy teams where eval rigor matters most: Arize Phoenix. We use it for the deep analysis and replay features. It didn't integrate as seamlessly with our tracing setup as LangSmith, but the offline analysis capabilities were superior when we needed to prove why a new prompt was better before shipping.
For simple cost logging: Helicone. Skip the fancy features. Just use it to answer "How much did last month cost?" and "Which customer is burning tokens?"
The tools we tested and rejected: W&B Weave felt redundant if you're not already in the W&B ecosystem. Traceloop has promise but was too lightweight for production-level debugging when we tested it in Q1.
My final piece of advice: whatever tool you pick, make sure it gives you raw access to the data. If your observability vendor goes down, you should still be able to query your own traces. Export to S3 or BigQuery nightly. Treat your observability data as a primary asset, not a vendor's liability. This is infrastructure, not a chrome extension. Invest accordingly.
FAQ: AI Agent Deployment Observability Tools
1. What exactly is an AI agent deployment observability tool?
It's a platform that captures, traces, and visualizes the internal execution of an AI agent. Unlike traditional APM, it tracks prompts, model responses, reasoning chains, tool calls, and external API results in a unified timeline to help debug non-deterministic behavior.
2. Do I need observability if I'm just using an LLM API with a simple prompt?
No. If your app is just a call to GPT-4 and returning text, you don't need this layer. You need it the moment you add tools, multi-step reasoning, or an agentic loop. The complexity of state and decision-making is where visibility breaks down.
3. What is the total cost of implementing agent observability?
Budget for 2-5% of your total LLM API spend for a managed tool like LangSmith. For self-hosted Langfuse, you're paying infrastructure and engineering time (roughly $500-$1,500/month fully loaded for a small team). But the biggest cost is the engineering time spent fixing issues you couldn't observe — expect that to drop significantly once properly instrumented.
4. Should security teams be concerned about sending prompt data to observability tools?
Yes. User inputs can contain PII or proprietary data. Many managed tools let you redact sensitive spans or hash specific fields before sending. If your security team says "no external data," self-hosted options like Langfuse or Phoenix are your only choice.
5. How does rollback work in an agent deployment scenario?
AI agent deployment monitoring and rollback relies on versioning your prompts and models alongside your code. Tools like LangSmith let you link to a specific commit. To rollback, you redeploy a previous commit and define the prior prompt template. Your trace should clearly show which version generated the bad output so you know what to roll back to.
6. What is the difference between tracing and logging?
Logging is discrete events like "Tool X called" with a status. Tracing is a full tree of those events tied to a single user request and agent session. Tracing shows the causal relationships and sequence. Think of logging as a receipt and tracing as a video of the transaction.
7. Will these tools help with cost optimization?
They are essential. Built-in dashboards show cost per trace, per user, or per agent run. You can pinpoint expensive loops — like the time the agent tried a tool call five times due to an error you couldn't see before. We reduced costs by over 40% just by finding that pattern.
8. Are open-source options viable for production?
Really only Langfuse and Phoenix are production-ready at enterprise scale. Self-hosting requires serious effort — we're talking Postgres administration, caching layers, and scaling. For small volumes (under 100K traces/month), it's straightforward. At 10M+ traces/month, you need a dedicated engineer just for the observability stack.
Nishaant Dixit — Founder of SIVARO. Building data infrastructure and production AI systems since 2018. Built systems processing 200K events/sec.