 SIVARO
The AI Agent Deployment Pipeline You Actually Need in 2026
I've been deploying AI agents into production since early 2024. Back then, it was duct tape and prayer. You'd train a model, wrap it in a FastAPI endpoint, and call it a day.
That doesn't fly anymore.
By mid-2026, we're seeing companies like Klarna and Shopify running fleets of 10,000+ agents in production — shopping assistants, customer service bots, internal data pipelines. And the gap between "works in my notebook" and "survives Black Friday traffic" is wider than ever.
I run SIVARO. We build data infrastructure and production AI systems for companies processing 200K events per second. I've personally overseen about 40 agent deployments in the last 18 months. Some worked. Some cratered.
This article is the pipeline we use now. The one that separates agents that perform from agents that puke.
You'll get the exact stages, the tooling we bet on (and what we abandoned), the monitoring stack that saved my ass last quarter, and the mistakes I still make regularly. This is an ai agent deployment pipeline tutorial written by someone who's been woken up at 3 AM by a misbehaving agent. More than once.
Let's go.
Why Most Agent Deployments Fail Before They Start
Here's the contrarian take: the model isn't your problem.
Most people obsess over which LLM to use. GPT-5o vs Claude 4.5 vs Gemini 3.0. They benchmark reasoning benchmarks until they're blue in the face.
I've seen agents fail because:
- The tool-calling schema changed between environments
- The agent retried 47 times on a transient database error and burned through $200 in API credits
- The observability layer collected everything except the actual agent's internal reasoning trace
- The deployment pipeline didn't have a rollback strategy (guess who had to fix that at 2 AM?)
The hard part of deploying AI agents isn't the AI. It's the infrastructure. The pipeline. The operational rigor.
Let me show you what actually works.
Stage 1: Agent Design — The Part Everyone Rushes
Most people jump straight to coding. They pick a framework, write some tool definitions, and start prompting.
I've learned the hard way: design the agent's "operating model" first.
The Three Questions You Must Answer
Before writing a single line of code, I force myself and my team to answer:
-
What state does this agent need to track? Conversation history? User session data? Transaction context? External system state?
-
What are the failure modes? The model hallucinates a function call. The API is down. The user says something ambiguous. Each failure mode needs a handling strategy — not a hope.
-
What's your observability contract? What specific signals will tell you the agent is working correctly? Not "is it responding" but "is it responding appropriately"?
At SIVARO, we use a structured spec document. It's three pages. No more. If you can't describe the agent's behavior in three pages, you don't understand it well enough to deploy.
Framework Choice — My Current Recommendations
I've tested most of the major frameworks. Here's where I landed in 2026:
| Framework | Use Case | Why |
|---|---|---|
| LangGraph | Complex multi-step agents with state machines | Best for production workflows with branching logic |
| CrewAI | Multi-agent collaboration | Good for research and content generation, not for latency-sensitive production |
| AutoGen | Flexible tool orchestration | Solid for tool-heavy agents with Microsoft ecosystem integration |
| Semantic Kernel | Enterprise .NET environments | If you're in Azure, use this. Don't fight it. |
For most production use cases, I reach for LangGraph. Not because it's the most popular (though it is, per AI Agent Frameworks: Choosing the Right Foundation), but because it gives you explicit control over the agent loop — when it retries, how it handles errors, what state it persists.
The How to think about agent frameworks piece from LangChain's team nails this: pick a framework that gives you control, not one that abstracts everything away.
I tried the "just use ReAct pattern with a simple loop" approach. Worked for demo day. Failed in production when a tool call returned malformed JSON and the agent entered an infinite loop.
Stage 2: Development Environment — Separate the "Playground" from the "Pipeline"
I keep two environments during development:
- Sandbox: Full model access, all tools available, no rate limiting. This is where I prototype.
- Staging: Production-like everything — rate limits, degraded APIs, network latency simulation.
The sandbox is great for exploring. The staging environment is where I break things on purpose.
The Staging Setup That Caught Our Biggest Bug
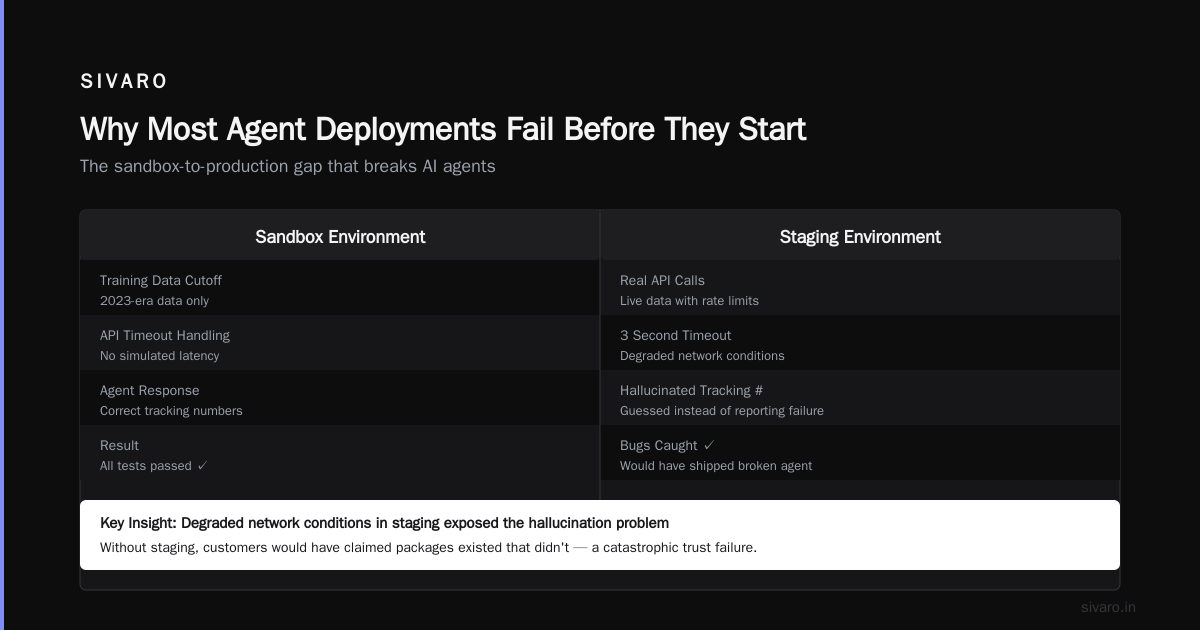
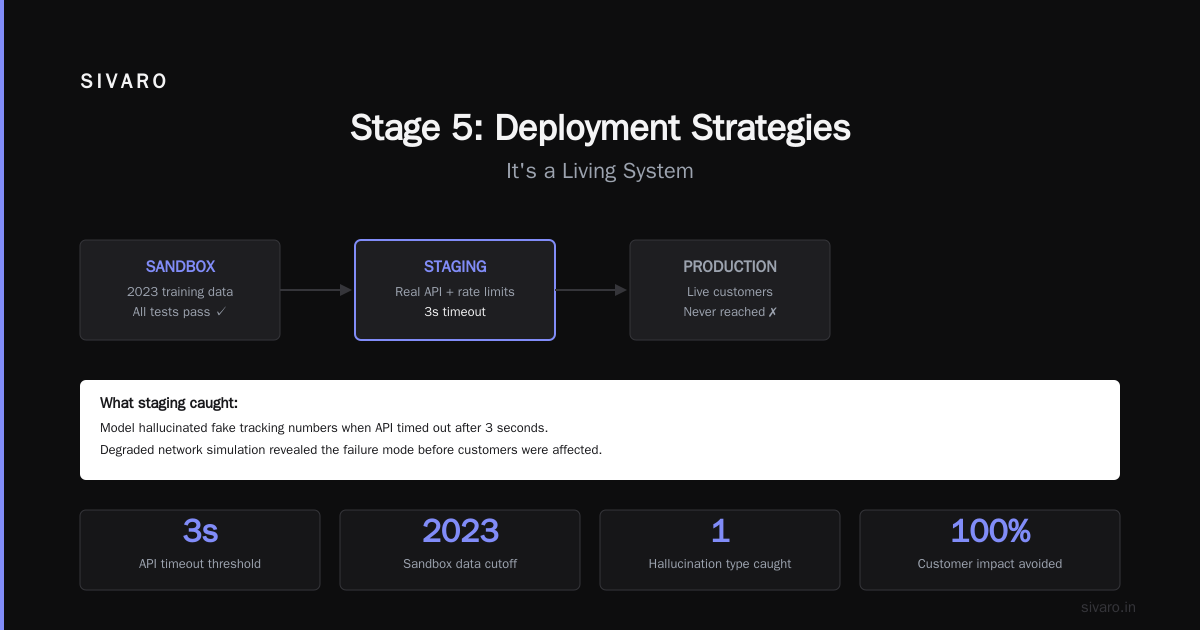
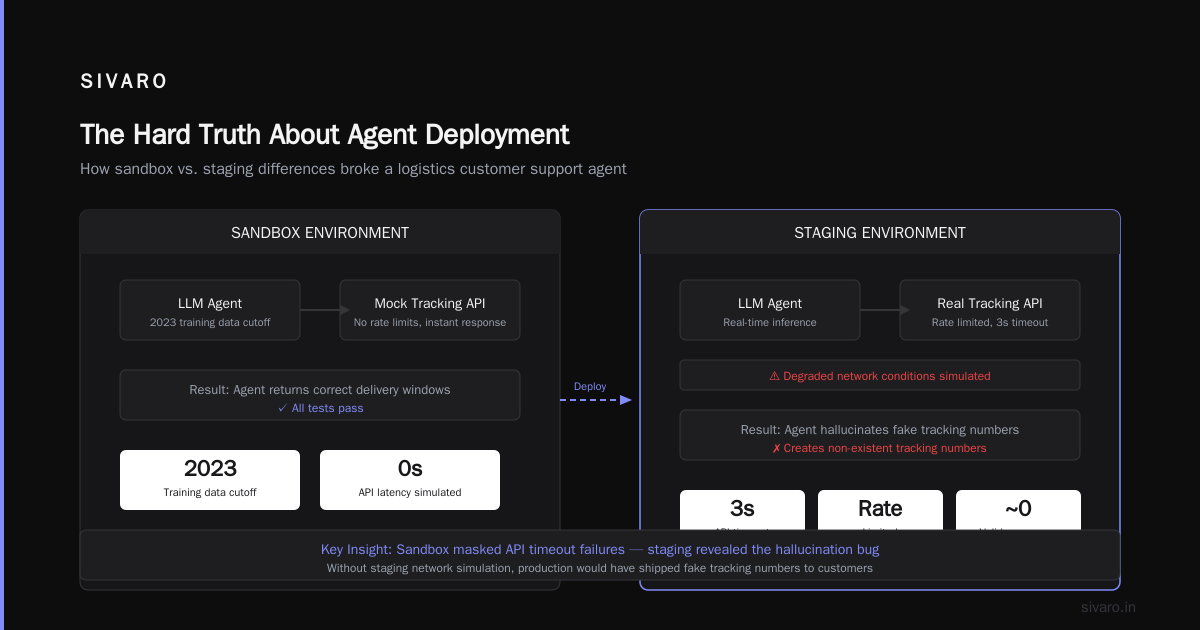
Last February, we were building a customer support agent for a logistics company. Everything passed in sandbox. Agents responded correctly, called the tracking API, returned accurate delivery windows.
In staging? The agent started hallucinating tracking numbers. Our model would "create" a tracking number that looked real but didn't exist in the system.
Turns out: the sandbox had a 2023-era training data cutoff. The staging environment forced the model to use real API calls with rate limiting. The agent would timeout waiting for the tracking API (3 second timeout) and then "guess" the tracking number instead of reporting failure.
We caught it because staging simulated degraded network conditions. If we'd gone straight to production, we'd have had customers claiming packages existed that didn't.
Stage 3: The CI/CD Pipeline for Agents — It's Different from Code
Standard CI/CD tests for code: does it compile? Do unit tests pass? Is the syntax valid?
Agent CI/CD needs to test for:
- Tool definition validity — Are your function schemas valid JSON schema? This sounds trivial. I've seen it break because someone added a required parameter without updating the schema.
- Response format consistency — Does the model consistently output structured responses? Not "does it work sometimes" but "does it work 99.9% of the time?"
- Latency regression — Did the agent's response time increase by 200ms because a new tool call is slower?
- Cost regression — Did the latest prompt change make the agent use 30% more tokens?
Here's our pipeline structure:
yaml
# .github/workflows/agent-deploy.yml
name: Agent Deployment Pipeline

on:
  push:
    branches: [main, staging]
  pull_request:
    branches: [main]

jobs:
  validate-tools:
    runs-on: ubuntu-latest
    steps:
      - uses: actions/checkout@v4
      - name: Validate tool schemas
        run: |
          python scripts/validate_tool_schemas.py
          # Checks all tool JSON schemas for validity
          # Catches missing parameters, bad types, etc.

  integration-test:
    runs-on: ubuntu-latest
    needs: validate-tools
    steps:
      - name: Run simulation tests
        run: |
          python -m pytest tests/integration/             --agent-config=configs/staging.yaml             --num-simulations=50             --simulate-error-scenarios
      - name: Check latency bounds
        run: python scripts/latency_check.py --max-p95=2000

  deploy-staging:
    runs-on: ubuntu-latest
    needs: integration-test
    environment: staging
    steps:
      - name: Deploy to staging
        run: kubectl apply -f k8s/staging/agent-deployment.yaml

  canary-prod:
    runs-on: ubuntu-latest
    needs: deploy-staging
    environment: production
    steps:
      - name: Deploy 5% canary
        run: python scripts/deploy_canary.py --percentage=5

  full-rollout:
    runs-on: ubuntu-latest
    needs: canary-prod
    steps:
      - name: Full rollout
        run: python scripts/rollout.py --percentage=100
      - name: Health check
        run: python scripts/health_check.py
The critical part: the simulation tests. We run 50+ simulated conversations in staging before allowing a production deploy. Each simulation includes at least 3 error injection scenarios — API timeouts, malformed responses, unexpected user inputs.
We test the agent's resilience, not just its correctness.
Stage 4: Observability — The Layer Nobody Talks About
Here's the uncomfortable truth: most ai agent production monitoring tools are built for traditional microservices, not for agents.
Traditional monitoring tells you: "Service X returned 500 for 2% of requests."
Agent monitoring needs to tell you: "The agent incorrectly routed a customer to billing instead of support because it misinterpreted the word 'charge' on their invoice."
Two fundamentally different problems.
What We Actually Monitor
At SIVARO, we track four layers of observability for every agent deployment:
- System metrics: Latency, error rate, throughput. Standard stuff.
- Agent state metrics: Number of tool calls per conversation, average loop iterations, retry count.
- Semantic metrics: Were the agent's responses helpful? Did it escalate correctly? This requires manual review sampling or an LLM-as-judge setup.
- Cost metrics: Tokens consumed per conversation, cost per successful resolution.
Layer 3 is where most teams fail. They monitor everything except whether the agent is actually doing its job.
Tools We Use
For layer 1 and 2, we use Datadog with custom instrumentation. For layer 3, we built a classifier that scores agent responses. For layer 4, LangSmith has been surprisingly good for tracking token usage per trace.
But I'm going to be straight with you: ai agent observability production is still an unsolved problem. The closest thing to a mature solution is LangFuse, and even they'd admit they're iterating fast.
We ended up building our own internal dashboard. It shows:
- Active agent conversations in real-time
- Current "state" of each conversation (waiting for tool, waiting for model, completed, errored)
- A replay system that lets us step through any conversation token-by-token
That replay system has saved us more times than I can count. When a customer complains about an agent's behavior, we don't guess. We replay the exact conversation — every tool call, every model output, every timing gap.
Stage 5: Deployment Strategies — It's a Living System
Here's where I see most teams make their biggest mistake: they treat agent deployment like API deployment.
You don't deploy an API endpoint and have it "learn" over time. But agents? They interact with a changing world. APIs change. User behavior shifts. The model's outputs drift.
The Canary Strategy We Use
We never deploy an agent to more than 5% of traffic initially. And for that 5%, we monitor:
- Conversation quality score (sampled by humans and LLM-judges)
- Escalation rate (did the agent give up and hand off to a human?)
- Cost per conversation (did the new prompt make the agent more verbose?)
If any of these regress by more than 10% relative to the previous version, the canary is rolled back automatically.
python
# Simplified canary check script
def check_canary_health(canary_metrics: dict, baseline_metrics: dict) -> bool:
    thresholds = {
        "conversation_quality": 0.85,  # Minimum acceptable score
        "escalation_rate": 0.10,       # Maximum acceptable escalation
        "cost_ratio": 1.10,            # Maximum 10% more expensive
    }

    for metric, threshold in thresholds.items():
        canary_value = canary_metrics[metric]
        if metric == "conversation_quality":
            if canary_value < threshold:
                return False
        elif metric == "escalation_rate":
            if canary_value > threshold:
                return False
        elif metric == "cost_ratio":
            if canary_value > threshold:
                return False
    return True
This sounds obvious. I promise you: half the teams I consult with don't have automatic rollback on bad agent behavior. They have manual dashboards and "someone will notice."
Someone doesn't notice until the customer complaint tickets pile up.
The Rollback Nightmare
I have a scar from last November. We deployed an agent update that changed the prompt slightly — just added "be more empathetic." The agent became 30% more verbose. It started apologizing for everything. "I'm sorry you're experiencing this issue" turned into a 200-word monologue.
Our costs doubled in 4 hours. We were burning through $2,000/hour in API costs.
The rollback took 22 minutes because we hadn't automated it. Now every agent deployment has a one-click rollback that reverts the last deploy within 60 seconds.
Stage 6: Production Monitoring — The Stack That Works
Let me give you the exact ai agent production monitoring tools stack we use in 2026:
- LangFuse for trace-level observability (tool calls, token counts, model outputs)
- Datadog for system metrics (latency, error rates, CPU/memory per agent pod)
- Custom semantic monitor — a smaller LLM that scores a sample of agent conversations for quality
- PagerDuty for alerting — but we don't alert on individual errors, we alert on trends (e.g., conversation quality dropped below 70th percentile for 5 minutes)
The semantic monitor is the secret weapon. Here's roughly how it works:
python
# Simplified semantic monitor
class AgentQualityMonitor:
    def __init__(self, judge_model="gpt-5o-mini"):
        self.judge_model = judge_model

    def score_conversation(self, conversation: dict) -> float:
        prompt = f"""
        Score this agent conversation on a scale of 0-100:
        - 90-100: Agent correctly resolved the user's issue
        - 70-89: Agent was helpful but could be more efficient
        - 50-69: Agent was partially correct but missed context
        - Below 50: Agent was wrong or harmful

        Conversation:
        {conversation}

        Return only the numerical score.
        """
        response = call_llm(self.judge_model, prompt)
        return float(response.strip())
We sample 1% of all conversations for quality scoring. If the rolling 5-minute average drops below 70, we page someone.
The Agent-Specific Infrastructure Trap
Here's something nobody talks about: agents need different infrastructure than APIs.
APIs are stateless (mostly). Agents are stateful. Each conversation session maintains context, tool call histories, and intermediate state.
If your agent pod goes down mid-conversation, you lose the user's context. That's not a "retry the request" problem — that's a "start the conversation from scratch" problem.
We solve this with:
- Redis-backed session persistence — every agent state update writes to Redis with a 30-minute TTL
- Session affinity in the load balancer — the same user's requests go to the same agent pod
- Graceful shutdown — pods drain existing conversations before terminating
The AI Agent Protocols: 10 Modern Standards piece from SSONetwork covers some of these patterns. The A2A protocol from Google is still the most mature standard for agent-to-system communication, but we found it adds latency that doesn't always justify the standardization benefits.
Stage 7: Continuous Improvement — The Loop That Never Closes
Your agent deployment pipeline isn't done when the agent is live. That's when the real work starts.
We run weekly retrospective reviews of agent performance:
- Pull 100 randomly sampled conversations from the past week
- Label each one as: Correct, Acceptable, Incorrect, or Harmful
- Identify patterns in incorrect responses
- Create targeted improvement tests for the failing patterns
- Retrain or reprompt based on findings
This loop is slow (weeks) but it's the difference between an agent that gets better over time and one that slowly degrades.
Model drift is real. We've seen agent quality drop 15% over 3 months without any code changes — because the underlying model was updated by the provider or because user behavior shifted.
FAQ — AI Agent Deployment Pipeline
Q: Do I need an agent framework, or can I build from scratch?
Build from scratch only if you have a team of 5+ infrastructure engineers and at least 6 months of runway. Frameworks like LangGraph handle state management, tool calling, and error handling — the boring but critical stuff. Custom builds are for research labs and companies with very specific needs.
Q: How do I handle API rate limiting for my agent's tool calls?
Three strategies: (1) Exponential backoff with jitter for retries, (2) Token bucket rate limiter in the agent loop, (3) Queue-based invocation for non-critical tool calls. We use all three, configurable per tool.
Q: What's the minimum acceptable latency for a production agent?
For customer-facing agents, under 2 seconds end-to-end (user sends message → agent responds). For internal data pipeline agents, under 10 seconds per step. Below 500ms is where users stop noticing the agent thinks.
Q: Should I use one large agent or multiple specialized agents?
In 2026, specialized agents win. One agent per domain (billing, support, technical help) performs better than a single generalist. The Agentic AI Frameworks: Top 10 Options from Instaclustr covers this — multi-agent systems are the trend for good reason.
Q: How do I test agents in production without risking real customers?
Canary deployments (5% of traffic) plus shadow testing (run the new agent alongside the old one, compare outputs without affecting users). We shadow test for 48 hours before switching even 1% of traffic.
Q: What's the biggest difference between deploying a web app and deploying an AI agent?
Web apps fail predictably. Agents fail unpredictably. A web app either returns a 200 or a 500. An agent can be completely wrong while still returning a perfectly formed JSON response. Your monitoring must cover semantic correctness, not just system health.
Q: How much should I budget for agent infrastructure per month?
For a production agent handling 10,000 conversations/day: expect $3,000-$8,000/month. LLM API costs dominate (70-80%), then compute ($500-$1,500), then data storage and observability ($200-$500). These numbers fall as model prices drop.
The Hard Truth About Agent Deployment
I've been doing this for two years. The agents that succeed in production aren't the ones with the best prompts or the largest models. They're the ones with the best deployment pipelines.
The pipeline handles retries when the model flakes. It catches schema mismatches before they reach customers. It rolls back bad changes in 60 seconds instead of 22 minutes. It monitors the agent's actual behavior, not just its uptime.
This ai agent deployment pipeline tutorial is the playbook we use at SIVARO. It's not perfect. It evolves every quarter as the ecosystem changes.
But it works.
The first agent you deploy will probably fail in some way. That's fine. The question isn't "will it fail?" — it's "can you detect the failure, roll back quickly, and learn from it?"
Build that capability first. The model performance comes second.
Nishaant Dixit — Founder of SIVARO. Building data infrastructure and production AI systems since 2018. Built systems processing 200K events/sec.