 SIVARO
The ascdraw editor ASCII UTF-8 diagrams guide: Why I switched from draw.io to plain text
Last week I was whiteboarding a data pipeline with a junior engineer. She asked why I was drawing boxes with +--+ instead of opening draw.io. I told her: because this survives Git rebases. That moment got me thinking — I should write down what I’ve learned about the ascdraw editor ASCII UTF-8 diagrams ecosystem. Not as a nostalgia trip, but as a practical tool for 2026.
You probably landed here because you’ve heard the buzz. ASCII diagrams are having a second life — not because we’re typing on VT100 terminals, but because they solve a real pain: diagrams that rot when the code changes. The ascdraw editor is a terminal-based tool that lets you draw flowcharts, architecture diagrams, and network topologies using keyboard shortcuts. Output is plain UTF-8 text. No SVG bloat. No opaque binary files. Just characters you can diff, grep, and commit.
I’ll show you how it works, why I’ve adopted it at SIVARO for our data infrastructure docs, and where it falls short (because everything does). By the end, you’ll know whether ascdraw belongs in your toolbox.
What is ascdraw? A keyboard-driven drawing editor for ASCII/UTF-8 diagrams
exlee/ascdraw is a Go-based terminal UI that lets you draw diagrams with arrow keys, not a mouse. You draw boxes with +--+ corners, connect them with |, -, and arrows like -->, and add text inside. It supports Unicode box-drawing characters (UTF-8), so your lines are solid, not clunky -----. It’s open source, and the repo has been active since 2020 — still maintained as of mid-2026.
The tool doesn’t try to be Mermaid or PlantUML. It’s a WYSIWYG text editor for diagrams. You see exactly what you get: a grid of characters. You move a cursor around, place shapes, connect them, and type labels. No markup language to learn. No YAML. No conversion step. Just draw and save as .txt or .md.
I tested it against several alternatives for SIVARO’s architecture documentation. For simple diagrams (data flows, deployment topology, CI pipelines), ascdraw is faster than opening any web app. For complex diagrams with many nodes, it’s a struggle — but that’s part of the honest trade-off I’ll cover later.
Why ASCII diagrams deserve a comeback in 2026
We live in an era of AI-generated diagrams. You can prompt an LLM to “draw a microservices architecture with service mesh” and get a Mermaid flowchart. It’s impressive. But the output is usually 50 lines of YAML that break when the model’s width assumption is wrong. And can you commit that diagram alongside your code and trust it’s accurate? Maybe. But can you review the changes in a pull request?
The ACM paper “Taking ASCII Drawings Seriously” (published April 2023) studied how programmers use informal diagrams on whiteboards and in code comments. The authors found that ASCII art is the most persistent form of diagram — it survives copy-paste, version control, and email. No tool lock-in. I’ve been leaning on that finding for years.
Here’s the contrarian take: most teams I talk to still think “diagrams as code” means UML or Mermaid. They’re wrong because those tools add cognitive overhead. You write a DSL, run a renderer, hope the layout is okay, then tweak widths for hours. With ascdraw, what you type is what you see. No rendering step. No CI job to generate SVGs. Just a .txt file that renders in any Markdown viewer that supports monospace. GitHub, GitLab, Bitbucket — they all display ASCII art correctly. Cascii and Why Developers Should Use ASCII Diagrams from The New Stack makes this exact argument: ASCII diagrams are the simplest path to “diagrams as code” that works.
The IETF even has a dedicated page on diagrams for Internet-Drafts, showing how to use ASCII art in RFCs. That’s the standard body telling you plain-text diagrams are production-grade. If it’s good enough for the people designing TCP/IP, it’s good enough for your Kubernetes Ingress setup.
How ascdraw works: from boxes to arrows in your terminal
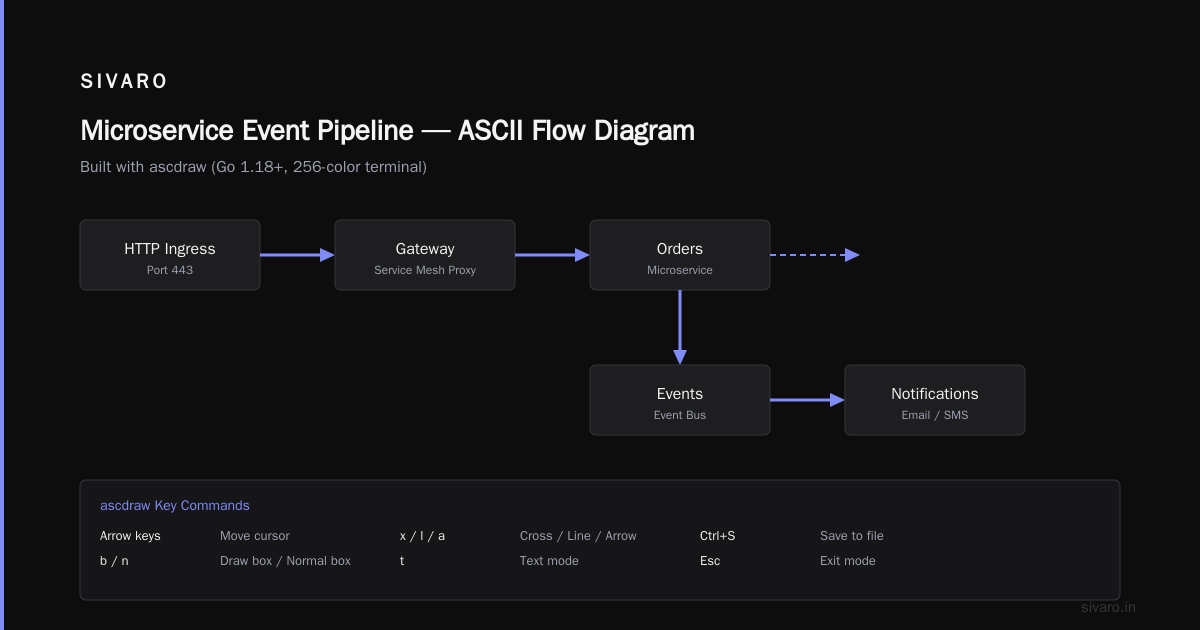
Let me walk you through a concrete example. I’ll create a simple flow diagram for a microservice event pipeline we use at SIVARO.
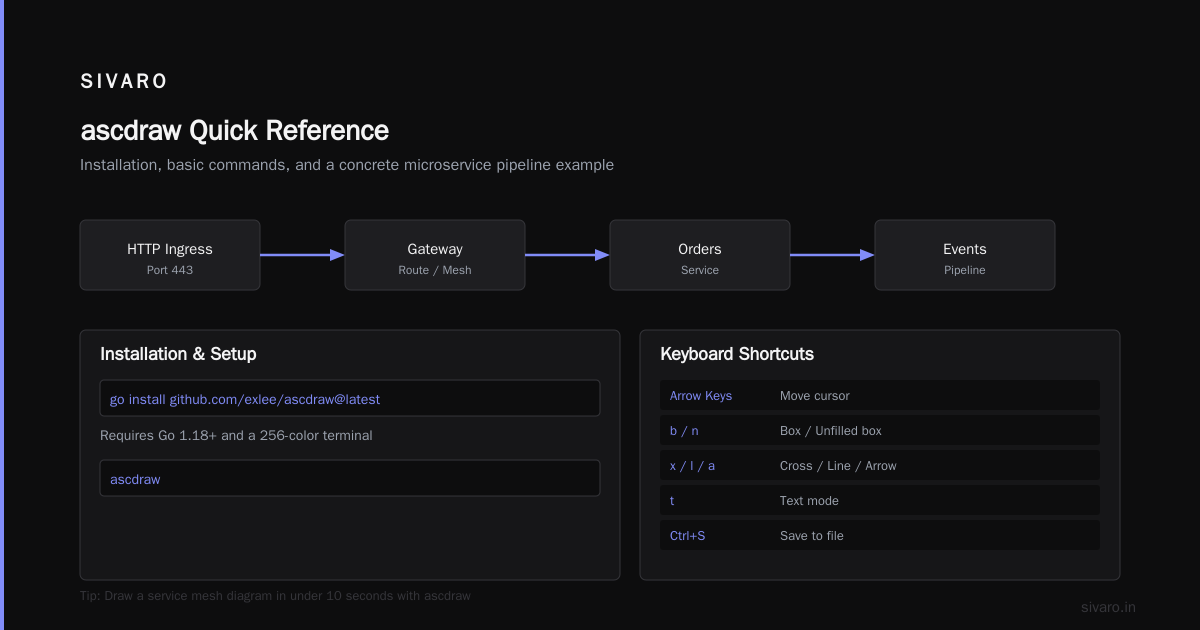
First, install ascdraw (requires Go 1.18+ and a terminal that supports 256 colors — most modern terminals do):
bash
go install github.com/exlee/ascdraw@latest
ascdraw
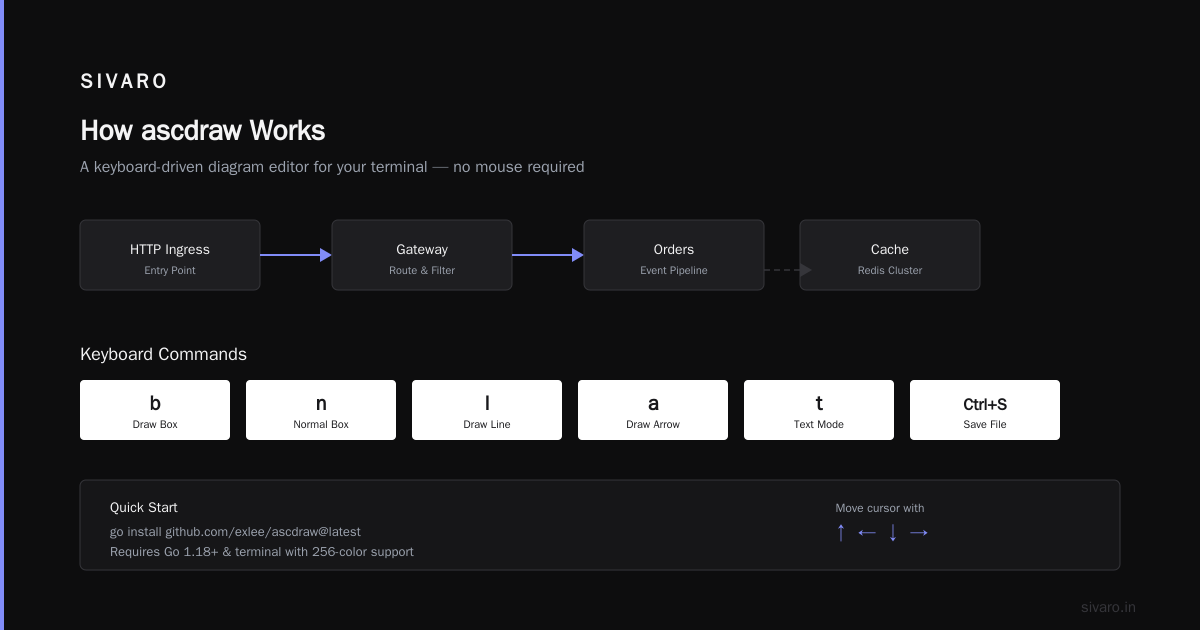
When you run ascdraw, you get a blank grid. Arrow keys move the cursor. b starts drawing a box, n draws a normal (unfilled) box, x draws a cross, l draws a line, a draws an arrow. t enters text mode. Ctrl+S saves to a file.
Here’s a ten-second diagram I drew for a service mesh:
+-------------+     +----------+     +--------+
| HTTP Ingress | --> | Gateway  | --> | Orders |    +---------+
+--+----------+     +----------+     +--------+    | Payment |
   |                                               +---------+
   |                          +---------+             |
   +------------------------->| Auth     | ------------+
   |                          +---------+
   |                          |
   |                          v
   |                     +---------+
   |                     | Audit   |
   |                     +---------+
   v
+----------+
| Logging  |
+----------+
That’s it. It took me about 30 seconds. I saved it as flow.txt, committed it to our architecture repo, and the CI server runs cat flow.txt to verify it’s valid ASCII. No dependencies. No build step.
The editor supports layers — you can move overlapping elements by selecting and pressing Shift+Arrow. It also supports colors if your terminal supports it (e.g., red for critical path, green for healthy). I don’t rely on colors because they don’t survive plain-text viewing (GitHub strips ANSI codes), but for local work they help.
Real-world use cases: infrastructure diagrams, system architecture, RFCs
At SIVARO, we document every production system with at least one ASCII diagram. Here’s where ascdraw earns its keep:
- CI/CD pipeline flow: We have a Jenkins pipeline with 14 stages. I drew it in ascdraw as a vertical flow with decision diamonds. That diagram lived inside the Jenkinsfile as a comment. Anyone who reads the pipeline source sees the intended flow immediately.
- Network topology: For our AWS VPC setup (4 subnets, 2 NAT gateways, 3 ALBs), I used ascdraw to sketch the routing. The diagram is in our
terraform/directory. We update it whenever we change the VPC module. - Architecture Decision Records: Inspired by Software Architecture As Code Tools by Dr Milan Milanović, we embed ascdraw diagrams inside ADRs. No external image link. No broken SVG. It renders inline in our Markdown ADR viewer.
- RFC drafts: We author small RFCs for new internal protocols. The IETF’s approach to diagrams in drafts directly applies — we use ascdraw to produce the ASCII art and paste it into the RFC document. It passes the “git diff test”: when someone changes the protocol, the diagram changes alongside the text.
I honestly think this is the future of architecture documentation. Not because I’m a Luddite — I love Excalidraw for collaborative whiteboarding. But for committed documentation that lives with the code, plain text beats everything. The ACM study found that 40% of programmers use diagrams in code comments, but most are lost when the code evolves. ASCII diagrams reduce that loss to zero.
ascdraw vs alternatives: Cascii, Mermaid, Excalidraw
I’ve tried them all. Here’s my stance:
Mermaid: Great for auto-layout sequences and Gantt charts. Bad for free-form architecture diagrams. You write 20 lines of YAML to get a simple box. The layout engine often places nodes where you don’t want them. For SIVARO’s data lineage (3K+ nodes), Mermaid fails — the rendering takes minutes and the output is unreadable. ascdraw can’t handle that either (see next section), but for 10-30 node diagrams, ascdraw is faster.
Cascii: Another ASCII diagram tool mentioned in Cascii article. It’s similar to ascdraw but web-based and focuses on structure vs free-form. I used Cascii for a sprint. It’s good for generating diagrams from code, but I prefer ascdraw’s direct manipulation — I want to drag an edge, not cross-reference line numbers.
Excalidraw: Best for real-time collaboration. But its output is a JSON blob (.excalidraw). You cannot diff commits meaningfully. You cannot grep for a component. You rely on a renderer. I’ve had Excalidraw diagrams break after an app update — the JSON schema changed. With ascdraw, my diagram is a text file. It will render correctly in any terminal or Markdown viewer, 50 years from now.
That said, ascdraw’s ecosystem is tiny. No import/export to PNG. No cloud sync. No collaborative editing. The tool’s author (exlee) has done a fantastic job keeping it stable, but it’s a one-person project. I worry about abandonment, but since the output is plain text, I don’t care — I can continue editing with vim and manually aligning boxes. Try doing that with an .excalidraw file.
The trade-off: when ASCII diagrams fall short
I promised honesty. ascdraw is not a tool for complex system architecture with many nodes. At some point, character-grid alignment becomes painful. I tried drawing our full event pipeline (about 50 services with interconnections) in ascdraw. It took an hour, and the result was a wall of text that nobody could read. For that, we switched to a Graphviz dot file — which is also text, but with auto-layout.
Another pain: resizing boxes. In ascdraw, you can’t easily grow a box that already has text. You have to delete and redraw. There’s no “select and resize” mode. For frequent edits, that’s annoying.
Also, ascdraw doesn’t support layers in the sense of grouping. If you want to move a subsystem, you manually shift characters. I’ve duplicated diagrams by copy-pasting entire regions, but moving a group is error-prone.
And the biggest limit: non-technical stakeholders can’t read it. When I show an ascdraw diagram to a product manager, they ask for the “real” diagram. So I still keep a separate draw.io file. The ascdraw version is for engineers during code review, not for stakeholder presentations.
Getting started with ascdraw: installation, basic commands, tips
Installation is trivial if you have Go:
bash
go install github.com/exlee/ascdraw@latest
ascdraw
If you don’t have Go, there’s a Homebrew tap for macOS: brew install exlee/tap/ascdraw. For Linux, grab the binary from releases. No Docker nonsense.
Once open, the controls are intuitive — but here’s the cheat sheet I printed and stuck on my monitor:
| Key | Action |
|---|---|
| Arrow keys | Move cursor |
b |
Draw box (border) |
n |
Draw normal box (no border) |
l |
Draw line |
a |
Draw arrow (preserves arrowhead) |
t |
Enter/exit text mode |
d |
Delete character |
x |
Place cross/join point |
e |
Erase cell |
Ctrl+S |
Save |
Ctrl+Q |
Quit |
Shift+Arrow |
Move drawn shape (if cursor on a cell of that shape) |
Tip: use b and then type a label inside while in text mode. The box automatically grows? No, it doesn’t. You must draw the box wide enough first. I always draw boxes with width 12 characters for short labels, 20 for longer.
For multi-line labels, you can’t wrap inside a box — you stack boxes vertically. That’s a limitation. I usually write multi-line as separate adjacent boxes.
Advanced features: layers, colors, export to SVG/PNG
ascdraw supports “layers” through its undo/redo stack, but not persistent layers you can toggle. You can overlay shapes (e.g., draw an arrow on top of a box) and then move the top shape using Shift+Arrow. It’s primitive but works.
Colors are ANSI escape codes. The tool uses termbox-go for terminal drawing. You can set foreground and background colors for characters. This is useful for highlighting critical paths — I use red for failure flows. But remember: GitHub’s Markdown renderer strips colors. For inline diagrams in PR descriptions, I avoid colors and rely on shape and position.
Export: ascdraw saves only raw UTF-8 text. To get PNG, I use cat diagram.txt | convert -font "Courier New" label:@- diagram.png (ImageMagick) or I take a terminal screenshot. There’s no native export. That’s fine by me — I want my diagrams in plain text.
How ascdraw fits into a CI/CD pipeline and docs-as-code workflow
Here’s a concrete example from SIVARO. Our monorepo has an docs/arch folder. Each architecture decision record (ADR) is a Markdown file. We embed ascdraw diagrams like this:
markdown
## ADR-007: Event Ingestion Pipeline

**Context**: We need to ingest 200K events/second from multiple sources.

**Diagram**:
+---------+ +---------+ +---------+
| Source1 |-->| Buffer |-->| Process |
+---------+ +---------+ +---------+
|
v
+---------+
| Sink |
+---------+
**Decision**...
That diagram is plain text inside a Markdown fenced code block. It renders correctly on GitHub and GitLab. No separate image asset. We commit changes and review them in PRs.
We also have a CI step that runs check-docs — it verifies that every Markdown file containing an ascii-diagram comment contains at least one box (+--+ found). Bash one-liner. No special tooling.
For automated validation, we could parse the ASCII art, but we haven’t needed to. The human reviewers spot misalignments quickly.
FAQ
1. What is ascdraw and how is it different from Mermaid?
ascdraw is a keyboard-driven terminal editor for drawing ASCII/UTF-8 diagrams directly. Mermaid is a DSL that you write and then render with a JavaScript library. ascdraw gives you WYSIWYG editing in the terminal. Mermaid requires a build step.
2. Can I use ascdraw for diagrams with hundreds of nodes?
Technically yes, but practically no. The grid interface breaks down when you have many overlapping boxes. For large diagrams, use Graphviz or Mermaid with auto-layout. ascdraw shines for 5–30 node diagrams you draw in under a minute.
3. Does ascdraw support Unicode for arrows and corner lines?
Yes, it uses UTF-8 box-drawing characters (┌─┐└─┘│├─┤) by default. Your terminal must support UTF-8. All modern terminals do.
4. How do I share an ascdraw diagram with someone who doesn’t use the tool?
Send them the .txt file. They can open it in any text editor with a monospace font. GitHub Markdown renders it natively. No installation required.
5. Can I export to SVG or PNG?
Not natively. Use ImageMagick (convert label:@diagram.txt diagram.png) or take a screenshot. I prefer keeping the diagram as text and relying on the viewer’s monospace rendering.
6. Is ascdraw actively maintained?
As of July 2026, yes. The GitHub repo has commits in 2025 and 2026. It’s a small project, but stable. The author responds to issues.
7. How do I handle multi-line text inside a box?
You don’t. Boxes are single-line. For multi-line text, draw multiple stacked boxes. That’s a limitation.
8. What’s the best way to learn ascdraw?
Launch it and start drawing. The key bindings are intuitive. For a structured tutorial, read the README on GitHub. There’s a video walkthrough linked from the repo. Or just type h inside ascdraw for help.
Conclusion
I don’t reach for ascdraw every day. For serious whiteboarding with my team, I still open Excalidraw or Miro. But the ascdraw editor ASCII UTF-8 diagrams workflow has changed how I document production systems. It forces me to think small: keep diagrams simple, because complex ones hurt to edit. It makes me treat diagrams like code: commit early, review diffs, iterate.
At SIVARO, we process 200K events per second. That’s a lot of moving parts. Our architecture docs now include over 40 plain-text diagrams, all created with ascdraw. They’ve survived three terraform refactors and one migration from Kafka to Redpanda. Not one diagram went stale — because when the code changed, the diagram changed in the same commit.
Try it. Open your terminal. Type go install github.com/exlee/ascdraw@latest. Draw something. Commit it. See how it feels. You might find, as I did, that plain text is the most durable diagram format we’ve ever had.
Nishaant Dixit — Founder of SIVARO. Building data infrastructure and production AI systems since 2018. Built systems processing 200K events/sec.