 SIVARO

Tools for LLM Reasoning Path Analysis: A Practitioner's Guide
I still remember the day I watched a $40K inference bill get explained by a single question: "Why did the model take 14 tool calls to answer something a junior engineer could've done in two?"
That's when I started taking tools for LLM reasoning path analysis seriously.
Here's the thing. If you're shipping LLM systems in production, you're not really debugging outputs anymore. You're debugging how the model got there. Reasoning path analysis is the practice of capturing, visualizing, and inspecting the intermediate steps an LLM takes — every thought, tool call, retrieval hop, and branch — before it produces a final answer. It's the difference between reading the answer key and watching the student solve the problem.
By the end of this, you'll know which tools actually work (I've tested a lot of them), how to instrument your own stack, and where most teams get it wrong.
Why Output-Level Debugging Is Dead
Most teams I talk to still log prompts and responses. That's a start, but it's not close to enough.
When GPT-4o hallucinated a customer's contract date last quarter for a client in the legal space, the response itself looked fine. Confident. Well-formatted. Wrong. But when we pulled the reasoning trace — the chain of retrieval calls and intermediate summaries — we saw exactly where it went off the rails. The retriever pulled a superseded contract version, and the model never questioned it.
You can't catch that from the final output.
Reasoning path analysis catches it. This is why tools for LLM reasoning path analysis have moved from "nice to have" to "table stakes" in any serious agent stack as of 2026.
What "Reasoning Path" Actually Means
Let's get concrete. A reasoning path is every intermediate state between your input and your output. Depending on your architecture, that includes:
- Chain-of-thought tokens (visible or hidden)
- Tool call sequences (which function, what args, what returned)
- Retrieval steps (which docs, scores, and in what order)
- Branching decisions (agent loops, planner choices)
- Sub-agent handoffs
- Token-level logprobs for the decisive steps
If you're running a single-shot completion, your reasoning path is thin. If you're running an agent with 8 tools and a retriever, your reasoning path is a graph, not a line.
Most "tracing" tools out there treat this as a linear log. That's wrong. They're graphs.
Categories of Tools You'll Actually Need
I've broken this into four buckets based on what I've shipped at SIVARO and what I've seen work at other teams.
Instrumentation and Tracing SDKs
These wrap your LLM calls and capture the path automatically. The big three right now are LangSmith, W&B Weave, and Braintrust. Arize Phoenix (open source, from Arize AI) is the one I keep coming back to for teams that need to run on-prem.
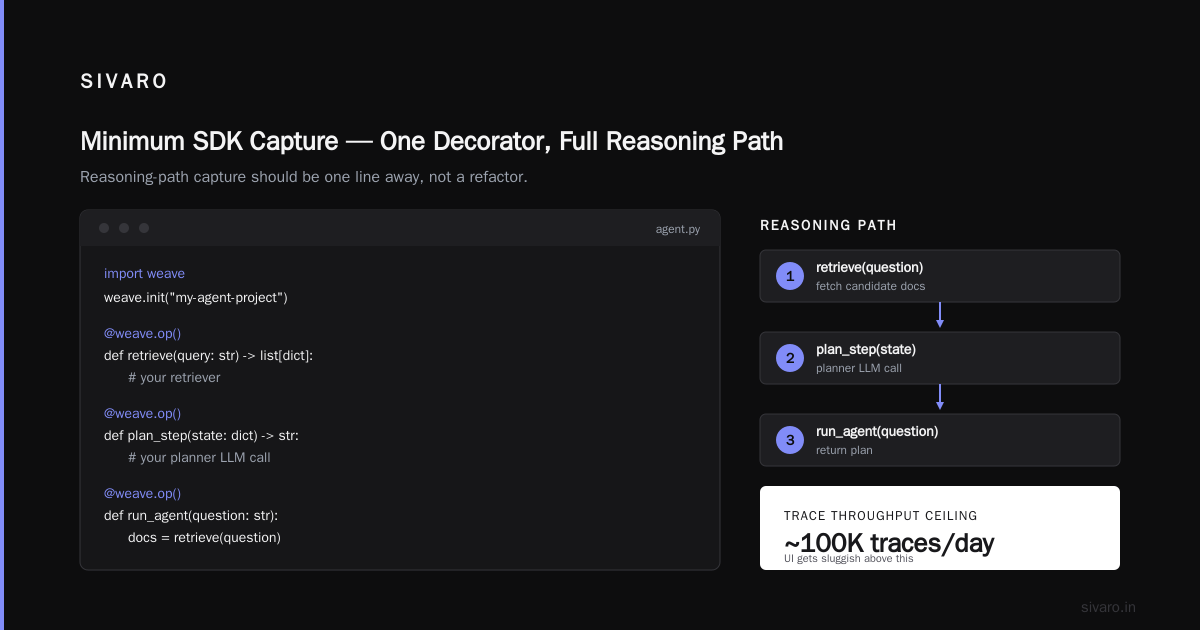
LangSmith wins on ecosystem if you're already in LangChain/LangGraph land. Weave is great for research teams because it plays well with the W&B experiment-tracking workflow you probably already have. Braintrust has the cleanest eval integration, in my opinion, but the UI gets sluggish above ~100K traces/day.
Here's the minimum you want an SDK to capture:
python
import weave

weave.init("my-agent-project")

@weave.op()
def retrieve(query: str) -> list[dict]:
    # your retriever
    ...

@weave.op()
def plan_step(state: dict) -> str:
    # your planner LLM call
    ...

@weave.op()
def run_agent(question: str):
    docs = retrieve(question)
    plan = plan_step({"q": question, "docs": docs})
    return plan
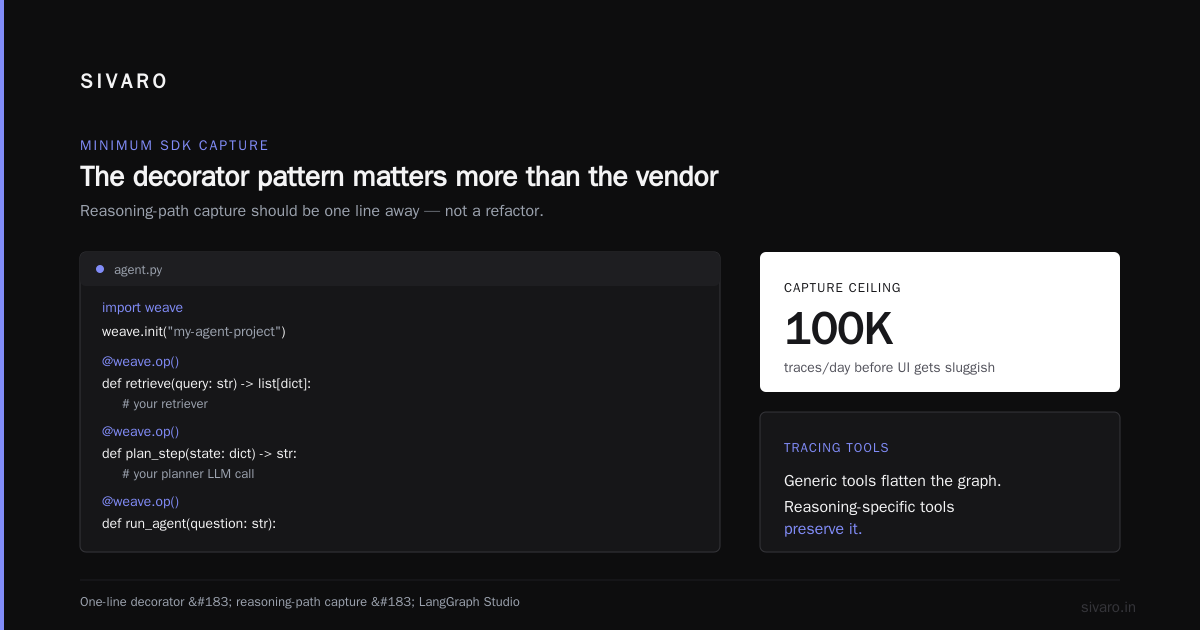
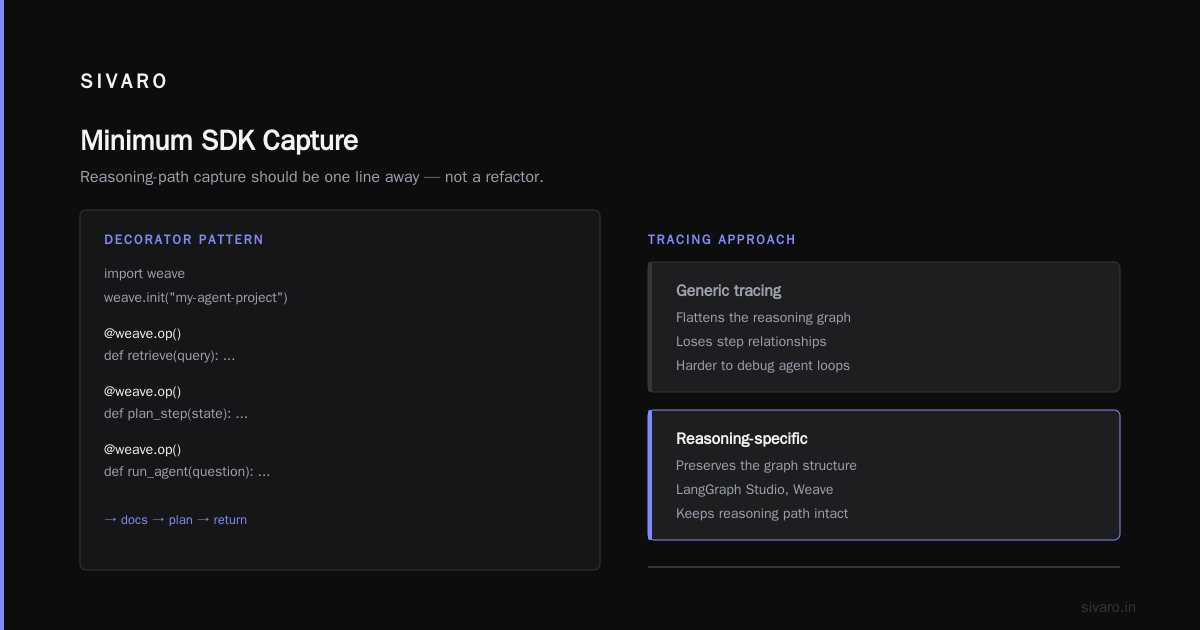
The decorator pattern matters more than the specific vendor. You want reasoning-path capture to be one line away, not a refactor.
Reasoning-Specific Visualizers
Generic tracing tools flatten the graph. Reasoning-specific tools preserve it. Two I've used in anger:
LangGraph Studio — if your agent is a state machine, this is the best visualization of it I've found. You can replay a run step-by-step, inspect state at each node, and fork the run at any checkpoint. That forking is the killer feature. You fix a bad prompt, replay from the divergence point, compare.
Phoenix by Arize — better for RAG-heavy paths. The retrievals-versus-generation breakdown is genuinely useful when you're chasing retrieval quality.
Generic dashboards like Datadog LLM Observability plug into your existing monitoring, which is nice if you're a platform team, but you'll want a reasoning-specific tool alongside it.
Evaluation Frameworks for Paths
This is where most teams underinvest. They eval the output, not the path.
The right pattern: score the trajectory, not just the destination. Inspect from the UK AI Safety Institute is the best open framework I've used for this. The Score API makes it trivial to attach a scorer to any step:
python
from inspect_ai import Task, eval
from inspect_ai.scorer import model_graded_fact

task = Task(
    dataset=my_trajectories,
    scorer=model_graded_fact(),
)
results = eval(task, model="anthropic/claude-sonnet-4-5")
You want to detect: unnecessary tool calls, retrieval misses, planner thrash (same tool called 3+ times with slight arg changes), and "confident wrong" states.
Custom Instrumentation (Yes, You Still Need This)
Off-the-shelf tools won't capture your domain semantics. If your agent handles insurance claims, "correct path" means something specific. No vendor knows that.
We build a thin internal layer on top of OpenTelemetry. Every reasoning step is a span. Every span has attributes for tool_name, retrieval_score, token_cost, decision_confidence. Then we query it like any other service.
python
from opentelemetry import trace

tracer = trace.get_tracer("agent.reasoning")

def decide_next(state):
    with tracer.start_as_current_span("reasoning.decide") as span:
        span.set_attribute("step_index", state["i"])
        span.set_attribute("candidate_tools", ",".join(state["tools"]))
        result = model.invoke(...)
        span.set_attribute("chosen_tool", result.tool)
        span.set_attribute("confidence", result.logprob)
        return result
Boring? Yes. Boring is good. It shows up in Grafana alongside your other services.
A How-To: Instrumenting Your First Reasoning Path
Here's the sequence I'd follow if I were standing up reasoning path analysis on a new agent this week.
Step 1 — Define What a "Path" Is For You
Write it down. Literally in a doc. For our RAG-rewrite agents, a path is: query → rewrite → retrieve → rerank → generate → cite. Six steps. Everything else is a sub-step.
If you can't draw your path on a whiteboard in 30 seconds, you don't have a defined path yet, and no tool will help.
Step 2 — Pick Your Transport
OpenTelemetry is the safe bet. It's standard, every observability vendor speaks it, and you own the data. LangSmith and Weave use proprietary transports, which is fine if you're happy to be tied in — but for anything touching regulated data, OTel + self-hosted backend is the move.
Step 3 — Add Step-Level Scorers
Don't score the final answer and call it a day. Score each step. Even crude scoring beats none.
python
def score_retrieval(step, expected_doc_ids):
    retrieved = {d["id"] for d in step["output"]}
    expected = set(expected_doc_ids)
    if not expected:
        return None
    return len(retrieved & expected) / len(expected)
Now you can see which retrieval calls are dragging down the whole path.
Step 4 — Detect Path Anomalies
The three patterns that pay for the tooling themselves:
- Loop thrash: same tool called with near-identical args 3+ times
- Orphan retrievals: retrieved docs never cited in the answer
- Silent rewrites: the model's rewritten query drifted >0.3 cosine from the original
We alert on all three. Loop thrash alone cut our p95 latency by 22% when we started auto-truncating after two identical attempts.
Step 5 — Build the Replay Harness
The single most valuable capability. Take a real production trace with a bad outcome, fork it at step N, tweak the prompt or tool, replay. If the fix works on 20 forked traces, you ship it.
This is what turns reasoning analysis from a debugging toy into a regression-prevention system. Every incident becomes a test case.
Where Most Teams Screw Up
Three patterns I see over and over.
They sample too little. Capturing 1% of traces feels economical. It's not. Rare failures hide in the long tail. We capture 100% of traces for agents, and only downsample the boring one-shot completions. Storage cost for text traces is negligible next to inference cost.
They instrument late. By the time you need the trace, you've already rewritten the agent twice and the path is gone. Instrument on day one.
They treat reasoning analysis as observability rather than a feedback loop. The teams that win use traces as training data. Score them, filter for high-signal examples, use them in evals. Every trace is a potential test.
Honest Trade-Offs
Reasoning path analysis isn't free.
- Latency overhead: typically 3-8% added to your P95 depending on async capture strategy. OTel batching hides most of it.
- Storage: budget around 10-40KB per trace for text-heavy agents. At 1M traces/month that's 10-40GB. Manageable, but plan for it.
- Vendor lock-in: LangSmith and Weave want you in their ecosystem. Fine for some teams, a non-starter for others.
- Cognitive load: having every path visible is different from having the right paths visible. Alert fatigue is real. Curate your views.
None of these are reasons not to do it. They're reasons to do it deliberately.
FAQ
What's the difference between LLM observability and reasoning path analysis?
Observability is the umbrella — logs, metrics, traces, cost. Reasoning path analysis is a specific discipline within it: reconstructing and inspecting the decision process, not just the calls. You can have great observability and still not know why your agent chose tool A over tool B.
Do I need a paid tool, or can I build it myself?
You can absolutely build it. OTel + a decent backend (Grafana Tempo, Jaeger, or ClickHouse) gets you 80% there. Buy when you need the visualization and eval ergonomics; build when you need control and cost predictability.
Which tools for llm reasoning path analysis work best with open-weight models?
Phoenix and Inspect are model-agnostic and work fine with Llama, Qwen, or DeepSeek. LangSmith and Weave assume API-based providers but you can point them at compatible endpoints (vLLM, TGI) with a bit of shimming.
How much does instrumentation slow down my agent?
Sync decorators can add 5-15% latency. Async/batched capture brings that to under 5%. The trade is worth it every time — an untraced agent in production is a liability, not an asset.
What's a "reasoning path" for a single-shot completion?
Just the chain-of-thought tokens and final output. Thin, but still useful. If you're using extended thinking models (Claude Sonnet 4.5, o1, DeepSeek-R1), the thinking tokens are the path and you should be capturing them.
Can I use reasoning path analysis for fine-tuning data?
Yes, and you should. Filter traces by score, take the high-signal ones, and you have a trajectory dataset for SFT. This is how we've been building domain-specific small models — the production traces are the curriculum.
What about privacy and compliance?
Reasoning paths often contain PII (retrieved docs, user input). You need redaction at capture time, not later. We hash sensitive fields before they hit the trace store. Plan for this in week one, not when legal shows up.
How do I know when I've captured "enough" of the path?
Rule of thumb: if a new engineer on your team can look at a trace and reconstruct the why of a wrong answer without asking you, you've captured enough. If they still have to ask, you're missing steps.
The Boring Truth
Tools for llm reasoning path analysis aren't magic. They're plumbing. Good plumbing. The teams that win with LLMs over the next 24 months won't be the ones with the fanciest models — they'll be the ones who can see exactly what their agents are doing and fix problems in hours instead of weeks.
Start with OTel. Add one visualizer. Score one step. Do it this week. Your future self, staring at a 3am page from a customer, will thank you.
The tools for LLM reasoning path analysis you pick matter less than the discipline of actually using them.
Nishaant Dixit — Founder of SIVARO. Building data infrastructure and production AI systems since 2018. Built systems processing 200K events/sec.