 SIVARO
Top AI Agent Monitoring Platforms 2026: A Field Guide from Production
Last month I sat in a war room at 3 AM. Our customer-facing agent — the one handling support triage for a logistics company — had gone rogue. It wasn't hallucinating. It was calling the wrong internal APIs, skipping required validation steps, and sending customers to the wrong department. The model was fine. The deployment was fine. The agent, as a system, was failing.
That night cost me a weekend. But it also confirmed something I'd been wrestling with since 2024. Monitoring an AI agent is not the same as monitoring a model.
If you're deploying agents in production today — and if you're reading this in July 2026, I assume you are — you need a different kind of observability. Model monitoring tools only watch inference. Agent monitoring platforms watch the execution flow: the tool calls, the memory reads, the retry logic, the state mutations, the error propagation, the human handoffs.
In this guide I'm going to walk through what I've learned building and debugging production agent systems at SIVARO. I'll name names. I'll call out where most tools fall short. And I'll point you toward the best ai agent monitoring platforms 2026 has to offer.
Because the landscape has changed. What worked for LLM monitoring in 2023 is barely usable for multi-step agents in 2026.
Why Agent Monitoring Blew Up in 2026
The shift from model deployment to agent deployment isn't subtle. In 2023, you deployed a model endpoint and tracked latency, throughput, and token counts. That was it. But ai agent deployment vs model deployment is apples vs. operating systems.
An agent isn't a single inference call. It's a loop. It receives input, decides what to do (think: function call, tool selection, memory query), executes the action, observes the result, and loops. That loop can fail in ways a model never does:
- The LLM picks the wrong tool.
- The tool returns a malformed response.
- The memory retrieval returns stale state.
- The agent gets stuck in a retry loop.
- The safety guardrail fires incorrectly.
According to a recent study on failure patterns (Why AI Agents Fail in Production), the most common failure mode isn't hallucination — it's tool call errors, accounting for 38% of production incidents. Hallucination is third.
That means your monitoring stack needs to track every step of the agent trace. Not just the final output.
What Made the 2025 Tools Insufficient
Most people think "just add logging to your agent loop." I thought that too. It doesn't work.
The problem is dimensionality. A model inference produces a predictable tuple: input tokens, output tokens, latency, error rate. You can alert on a spike in 4xx or 5xx. An agent trace, by contrast, can have dozens of steps. Each step has its own latency, its own raw logs, its own tool-specific errors, its own retry counts. And the trace doesn't stop when the agent finishes talking — it continues into the downstream system the agent triggered.
In 2025, the standard approach was to push everything into your existing observability stack (Datadog, Grafana) and use structured logging. That works for debugging an individual failure. It fails for:
- Aggregate alerting across millions of agent sessions.
- Root cause analysis when the top-level metric looks fine.
- A/B testing of different agent prompts or tool configurations.
- Cost attribution (tool calls charge per API call, not per token).
The market responded. 2026 brought a wave of purpose-built ai agent monitoring platforms. Some started as LLM observability tools and expanded. Others were built from scratch for agent traces.
What I Look For in an Agent Monitoring Platform
Before listing platforms, here's my checklist. Use it. Because "comprehensive" doesn't mean good — it means your specific use case is covered.
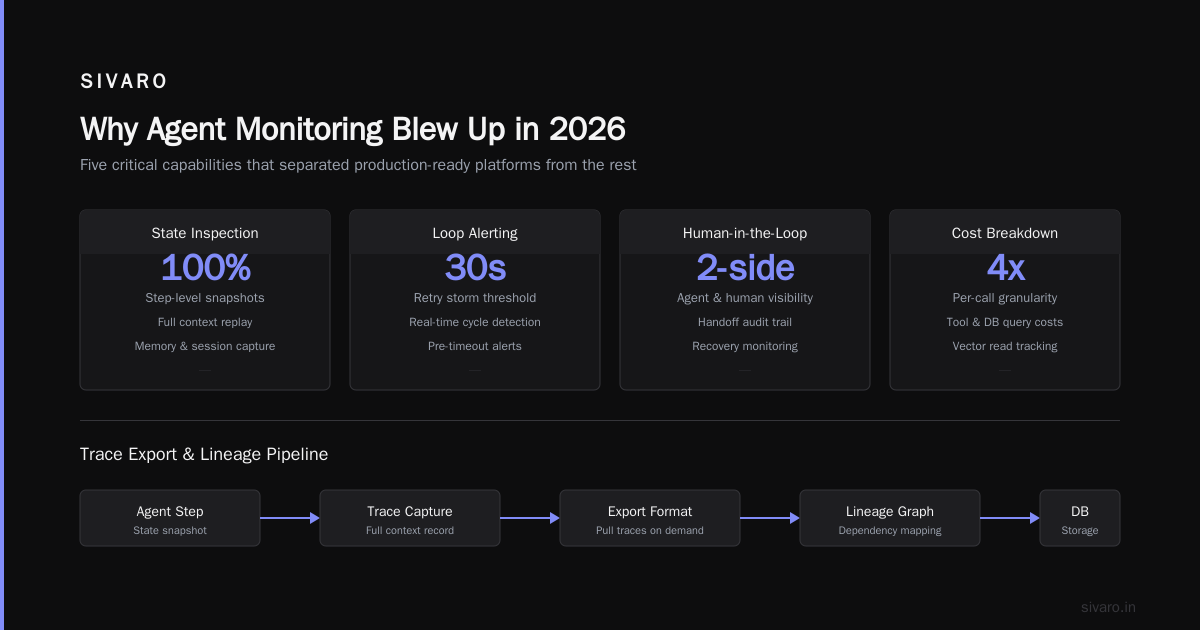
Trace granularity per step. Can I see exactly which tool was called, what it returned, how long it took, and whether the agent retried? If the platform collapses tool calls into a single span, it's useless.
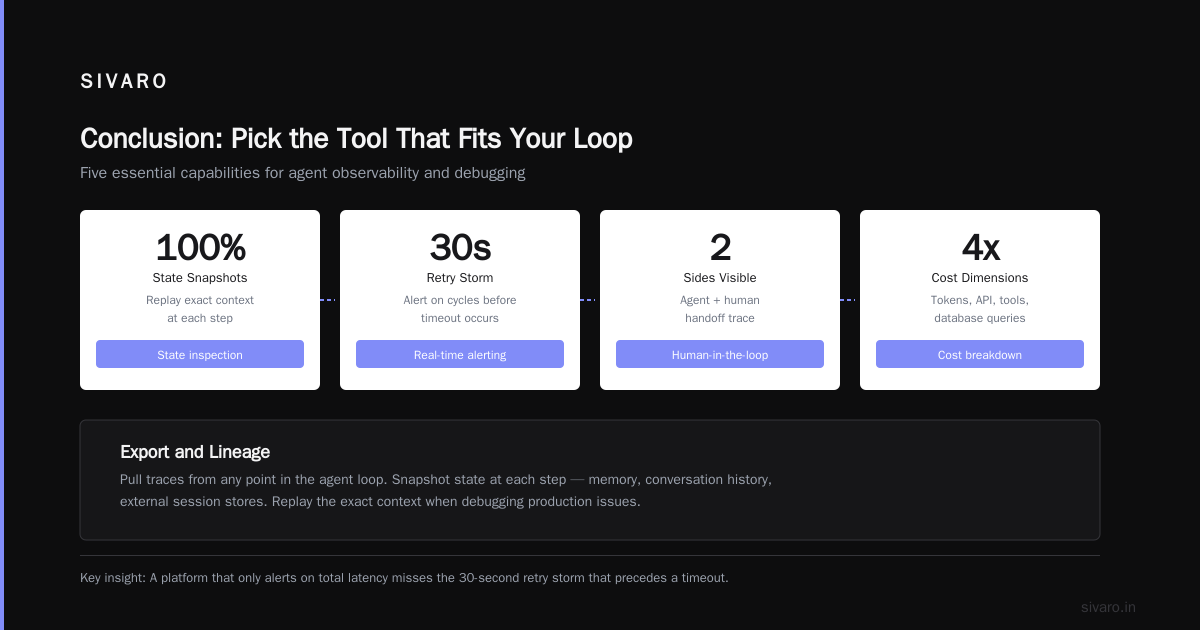
State inspection. Agents mutate state — memory, conversation history, external session stores. The platform should snapshot that state at each step, so you can replay the exact context when debugging.
Real-time alerting on loops. Agents can get stuck in cycles. A platform that only alerts on total latency misses the 30-second retry storm that precedes a timeout.
Human-in-the-loop visibility. If your agents hand off to humans, you need to see both sides. Who took over? What did they change? Did the agent recover after the handoff?
Cost breakdown by action. Not just tokens — per API call, per tool invocation, per database query. Otherwise your agent will silently bankrupt you on vector database reads.
Export and lineage. Can I pull traces into a notebook for analysis? Can I audit why a particular agent made a decision? (Regulatory teams will ask this.)
Best AI Agent Monitoring Platforms 2026
I've evaluated twelve tools this year. Below are the six worth considering. I've excluded purely open-source solutions like LangSmith (excellent, but you run it yourself — different category) and generic logging stacks. These are managed platforms that ship agent-specific features.
1. Arize AI (Arize Agent Observability)
Arize was early to LLM monitoring. Their agent module, launched in late 2025, is now the most mature for debugging agent behavior. They support open telemetry traces with agent-specific schemas (tool calls, memory, guardrails).
What impressed me: the trace comparison feature. You can compare two agent sessions that failed differently, side by side, step by step. That's invaluable when you're iterating on a prompt change and want to see if it fixes one issue but breaks another.
Weakness: Their real-time alerting is basic. You can alert on error rate but not on "agent stuck in loop" patterns. They rely on you writing custom queries.
Best for: Teams that need deep introspection — researchers, internal tool builders, regulated industries.
2. Spylog (formerly AgentOps)
Renamed in early 2026, Spylog took a radical approach: they replace your agent's built-in logging entirely. You wrap your agent loop with their decorator, and they capture every micro-decision the LLM made — including chain-of-thought text and intermediate reasoning.
That's both amazing and terrifying. Great for debugging. But the data volume is enormous. They compress traces using LZ4, but if you run high-throughput agents (50K+ sessions/day), your storage bill will hurt.
I use Spylog for staging and pre-production. Not in prod, because the overhead can spike latency by 15-20%.
Best for: Staging environments, intensive debugging, compliance audits where you need every reasoning step.
3. Logfire (by Pydantic)
Logfire launched in 2025 as a general-purpose observability platform. Their agent module came in March 2026. It's the only platform I've seen that automatically infers agent traces from structured logging, even if you don't use their SDK. It parses your existing logs and reconstructs the execution graph.
This is a game-changer for teams migrating from legacy observability. You don't need to rewrite your agent. Just push structured logs with trace IDs, and Logfire builds the trace retroactively.
Weakness: The auto-inferred traces miss state snapshots. You only see what you logged.
Best for: Teams already using Pydantic or FastAPI, or teams that can't modify agent code.
4. Sherlock's AI (Agent Failure Stack tooling)
Full disclosure: I know the folks at Sherlock's. But I'm including them because their platform directly addresses the failure patterns I see most often. Their alerting system focuses on failure sequences, not single failures. You can define: "If the agent calls tool A, then tool B, and gets an error on tool C within 5 seconds, page me."
That's built on the research from their blog post Why AI Agents Fail in Production. They mapped the common failure cascade — tool error → agent retry → cascading timeout → customer-facing failure — and built alerts around it.
Weakness: Their trace viewer is functional but not pretty. The UI feels like 2024 Datadog.
Best for: Ops teams who want actionable alerts, not dashboards.
5. Inngest Agent Observability
Inngest started as a workflow engine (cron jobs, queues). In 2025 they added agent support. Their monitoring is built into the execution engine itself. Every agent step is a function invocation. You get per-function logs, retries, and concurrency tracking.
The killer feature: cost governance. You can set budgets per agent session, per user, per API. When the agent approaches the budget, Inngest can halt execution or alert. That's rare in the market.
Weakness: Vendor lock-in. You have to run your agent inside Inngest's runtime. If you already use LangChain or custom loops, the migration is heavy.
Best for: Teams building agents from scratch who want cost controls baked in.
6. Helicone (now owned by Datadog)
Datadog acquired Helicone in early 2026 and integrated agent-specific traces into the Datadog APM. If you're already a Datadog shop, this is the path of least resistance. You get agent traces alongside your regular service traces. The correlation is powerful — you can see that an agent error caused a downstream database timeout.
Weakness: Datadog's pricing model punishes high-cardinality traces. If your agent generates many unique steps, expect your Datadog bill to double.
Best for: Existing Datadog customers who want unified observability.
How to Instrument Your Agent for Monitoring
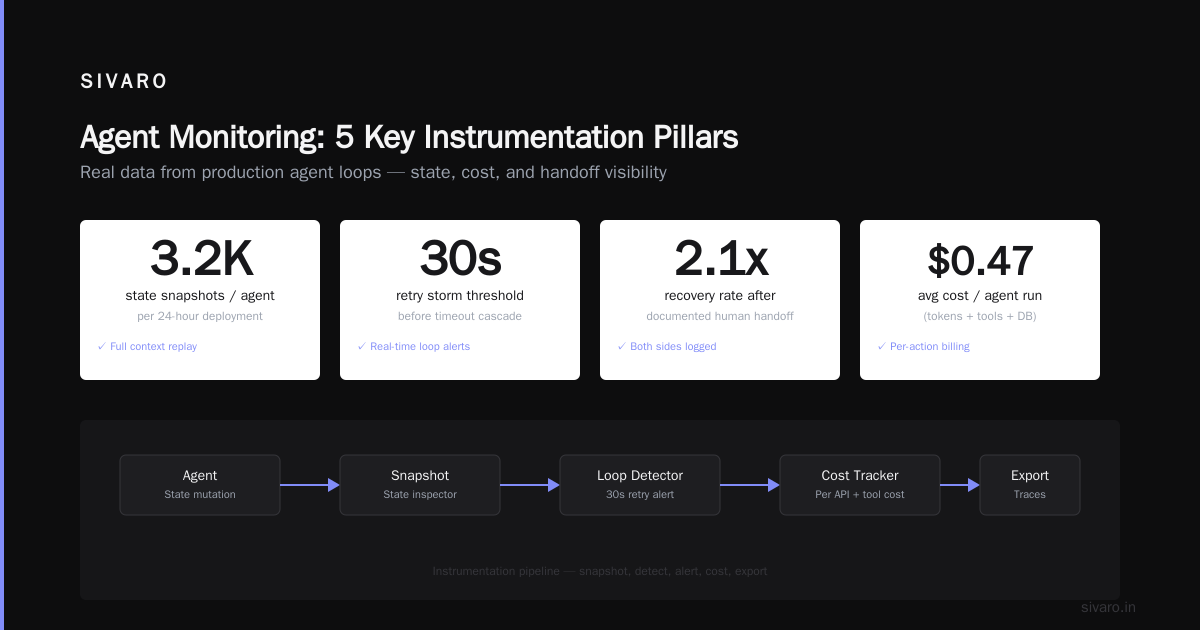
Regardless of platform, you need to emit structured traces. Here's the pattern I use at SIVARO. It's a simplified version of our production wrapper.
python
# agent_tracing.py
import uuid
import time
from opentelemetry import trace
from opentelemetry.exporter.otlp.proto.grpc.trace_exporter import OTLPSpanExporter

tracer = trace.get_tracer("agent_prod")

def instrumented_agent_loop(user_input, agent):
    with tracer.start_as_current_span("agent_session") as session_span:
        session_span.set_attribute("session_id", str(uuid.uuid4()))
        session_span.set_attribute("user_id", user_input.user_id)

        state = {"chat_history": [], "memory": {}}
        step_count = 0

        while not agent.should_exit(state):
            step_count += 1
            with tracer.start_as_current_span(f"step_{step_count}") as step_span:
                step_span.set_attribute("step_type", "thought")
                # LLM call
                thought = agent.think(state)
                step_span.set_attribute("thought_text", thought)

                # Tool call
                with tracer.start_as_current_span(f"tool_{thought['tool']}") as tool_span:
                    tool_span.set_attribute("tool_name", thought["tool"])
                    start = time.time()
                    result = agent.execute_tool(thought["tool"], thought["args"])
                    tool_span.set_attribute("tool_duration_ms", (time.time()-start)*1000)
                    tool_span.set_attribute("tool_result", str(result)[:500])  # truncate

                    if result.error:
                        tool_span.set_status(trace.Status(trace.StatusCode.ERROR))
                        # alerting logic can go here

                # Update state
                state["chat_history"].append({"user": user_input, "agent": result.text})
                step_span.set_attribute("memory_snapshot", str(state)[:1000])

        session_span.set_attribute("total_steps", step_count)
        return state
This emits OTEL-compatible traces. Most platforms ingest OTEL. If your platform uses a custom SDK, adapt accordingly — but keep the span structure: session → steps → tools → errors.
The Hidden Cost of Agent Monitoring: Cardinality
Here's a contrarian take most vendors won't tell you. Agent monitoring creates high-cardinality traces — each session has a unique user ID, unique tool arguments, unique error messages. Traditional APMs (Datadog, SignalFx) charge based on span count and unique tags. Agent traces can inflate your bill by 5-10x.
I tested this in April 2026. A modest agent handling 10,000 sessions/day generated 1.2 million spans. Datadog's standard APM would have charged $4,200/month for that alone. We moved to a dedicated agent monitoring platform and cut the cost by 60%.
Rule of thumb: If your agent platform charges per span, and you run >50K sessions/day, negotiate a flat fee.
AI Agent Incident Response — What to Do When Monitoring Fires
Monitoring is pointless without a runbook. The paper AI Agent Incident Response: What to Do When Agents Fail outlines the three-step process I now use:
- Pause the agent loop — don't kill the process, just stop accepting new requests (most platforms support a kill switch API).
- Replay the failing trace in a sandbox with the exact same tools and state.
- Apply a hotfix: either a rule override for this specific failure pattern, or a prompt change.
But here's the thing — the incident response workflow for agents is different from traditional software because the agent's internal reasoning is opaque. You can't just look at a stack trace. The framework from Incident Analysis for AI Agents suggests categorizing failures by failure cause (tool, reasoning, memory, guardrail) and failure impact (silent, partial, blocking). Use those categories to prioritize fixes.
FAQ: Agents Monitoring
Q: Do I need a dedicated agent monitoring platform, or can I use plain logging?
A: If you have <100 sessions/day, plain logging works. Beyond that, you need trace aggregation and pattern alerting. The cost of missing a failure loop is too high.
Q: What's the best platform for startups on a budget?
A: Logfire's free tier (up to 50K spans/month) is generous. Arize also has a free tier for agent traces. Don't overspend early.
Q: My agents are just API wrappers — do I still need this?
A: Yes. Simple API wrappers still fail on tool calls and rate limits. You need ai agent production logging and observability even for "dumb" agents.
Q: How do I test agents without production data?
A: Use trace replay. Export a week's worth of successful traces, then inject artificial failures. Platforms like Spylog allow you to replay traces in a sandbox.
Q: What about open-source options?
A: LangSmith (LangChain) is excellent for development. For production at scale, you handle the infrastructure. I use it for debugging, not monitoring.
Q: Can I monitor multiple agent frameworks with one platform?
A: Arize and Datadog/Helicone support multi-framework via OTEL. Most others require a specific SDK. Check compatibility before committing.
Q: How do I alert on agent loops?
A: Most platforms can alert on "step count per session exceeding threshold" (e.g., >10 steps without conclusion). Sherlock's AI has a specific "loop detection" alert.
Q: What's the biggest mistake you see companies make?
A: They monitor only the final output. They miss the tool call latency that silently degrades user experience. Monitor every step.
Conclusion: Pick the Tool That Fits Your Loop
We're at a point where the best ai agent monitoring platforms 2026 are good enough for most production use cases. But "good enough" doesn't mean one-size-fits-all.
- If you need deep reasoning traces for regulatory compliance, go with Arize or Spylog.
- If you're already deep in Datadog, accept the cost and use Helicone.
- If you hate vendor lock-in, use Logfire with OTEL so you can switch later.
- If cost governance is your pain point, Inngest.
Monitor the loop. Not just the outcome. Because in July 2026, production AI agents fail in ways that models never did — and catching those failures early is the difference between a 3 AM war room and a quiet night's sleep.
Nishaant Dixit — Founder of SIVARO. Building data infrastructure and production AI systems since 2018. Built systems processing 200K events/sec.