 SIVARO

What Does Disaggregating Data Mean? A Practitioner’s Guide
I was sitting in a product review at a fintech startup in early 2024. The team showed me their “conversion funnel”—aggregated across all users. 68% conversion from signup to first transaction. Everyone nodded. “Great numbers.”
I asked one question: “What does it look like by region?”
Silence. Then the PM pulled a report. Southeast Asia: 89%. Western Europe: 42%. India: 31%. The aggregate number was hiding a disaster in two markets and a misleading success in a third.
That’s what disaggregating data means. Breaking aggregated data into finer subgroups so you can see patterns that averages erase. It’s not just a technical operation. It’s a weapon against bad decisions.
In this guide I’ll walk you through what disaggregating data actually means—in social impact, in education, in engineering—and when you shouldn’t do it. You’ll get real examples, code snippets, and the trade-offs I’ve seen first‑hand over eight years of building data systems at SIVARO.
The Simple Definition (And Why Most People Get It Wrong)
At its core, disaggregation is the inverse of aggregation. If aggregation is summing or averaging data, disaggregation is splitting it back into its parts. You take a dataset that groups people, transactions, or events together and you break it apart by relevant dimensions—race, income, location, time, device type, whatever.
But here’s where people screw up. They think disaggregation is just running a GROUP BY in SQL. It’s not. Disaggregation is a deliberate analytical choice. The word “what does disaggregating data mean?” isn’t asking about the SQL syntax. It’s asking: why should I care?
Glossary: Disaggregated data | Monitoring Guide puts it plainly: “Disaggregated data enables identification of inequalities and discrimination that may be hidden in aggregate averages.”
Most people assume the average represents everyone. It doesn’t. The average is a mathematical abstraction that often corresponds to no actual person. Disaggregation forces you to look at real subgroups.
Disaggregated Data Explained Clearly gives a concrete example: a company’s overall latency is 200ms, but breaking it down by service reveals one microservice averaging 2 seconds. The aggregate told you nothing about the problem.
Here’s my rule: Every time you see an average, ask who it’s hiding. That’s the start of disaggregation.
Why You Can’t Afford to Ignore Disaggregation
Two words: hidden inequity.
Race data disaggregation: What does it mean? Why ... shows how combining Asian, Black, Hispanic, and White students into one “pass rate” masks massive disparities. The aggregated pass rate might be 75%. That looks okay. But disaggregate by race and you might find Black students at 40%, Hispanic at 55%, Asian at 90%. The average was a lie.
Same thing in education. What happens when you disaggregate your student ... describes a university where the overall retention rate was fine—but first‑generation students had a 20 percentage point drop. The school was ignoring them.
I’ve seen this pattern repeat in product data. A SaaS company told me their NPS was 42. Sounded solid. We disaggregated by customer segment: enterprise was 65, SMB was 38, startup was 22. The aggregate was useless for deciding what to build next.
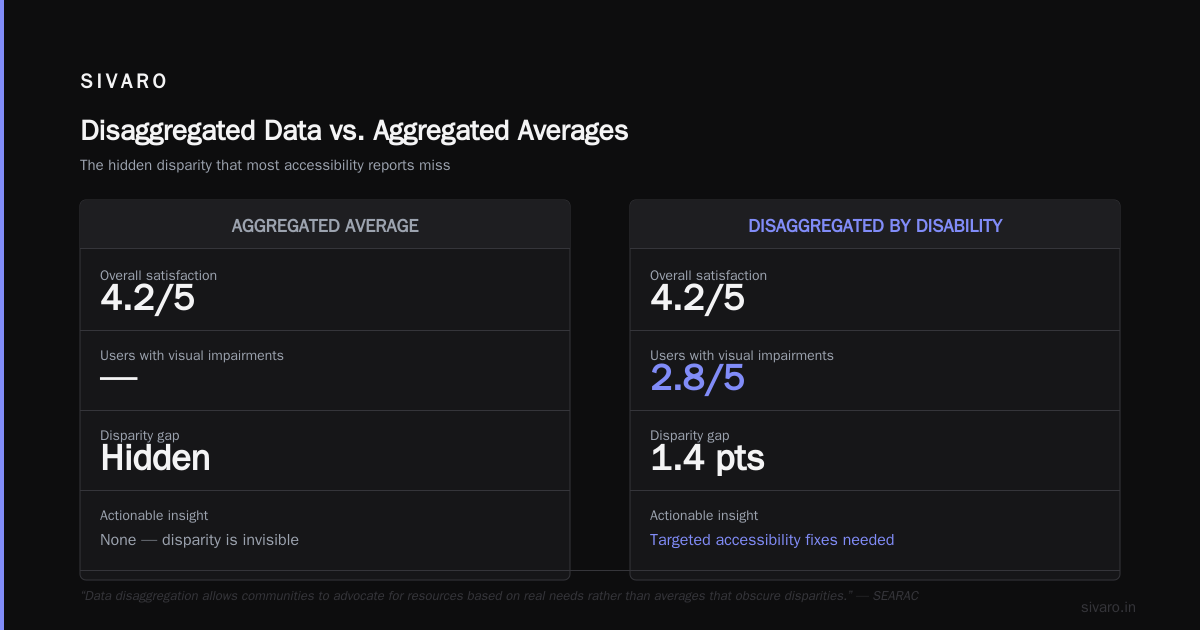
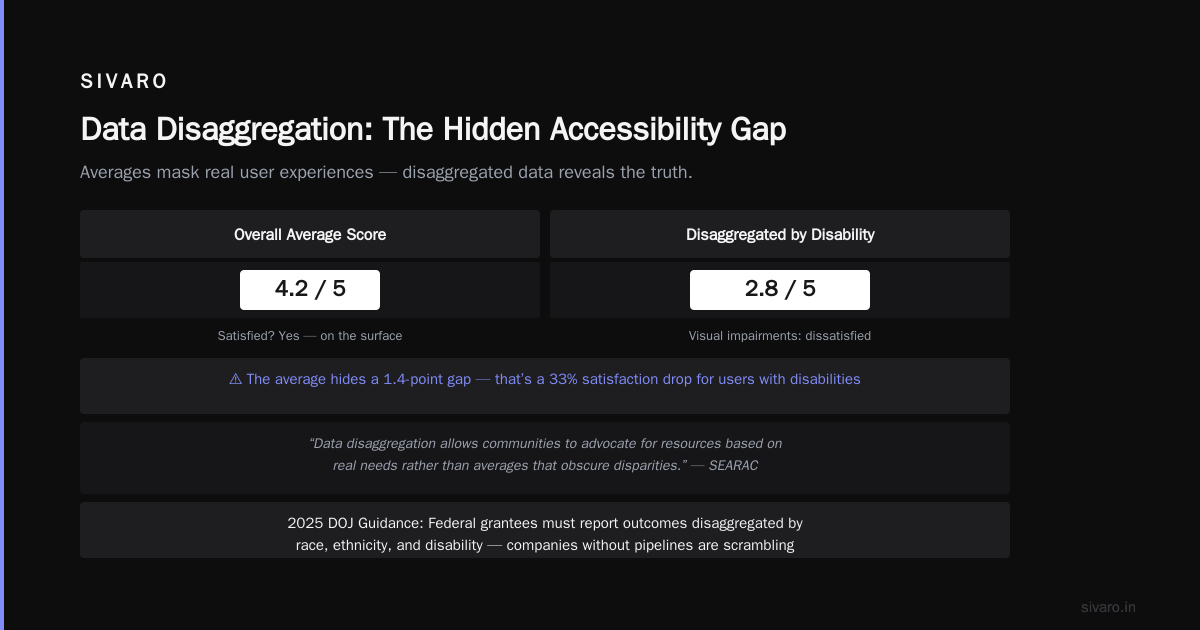
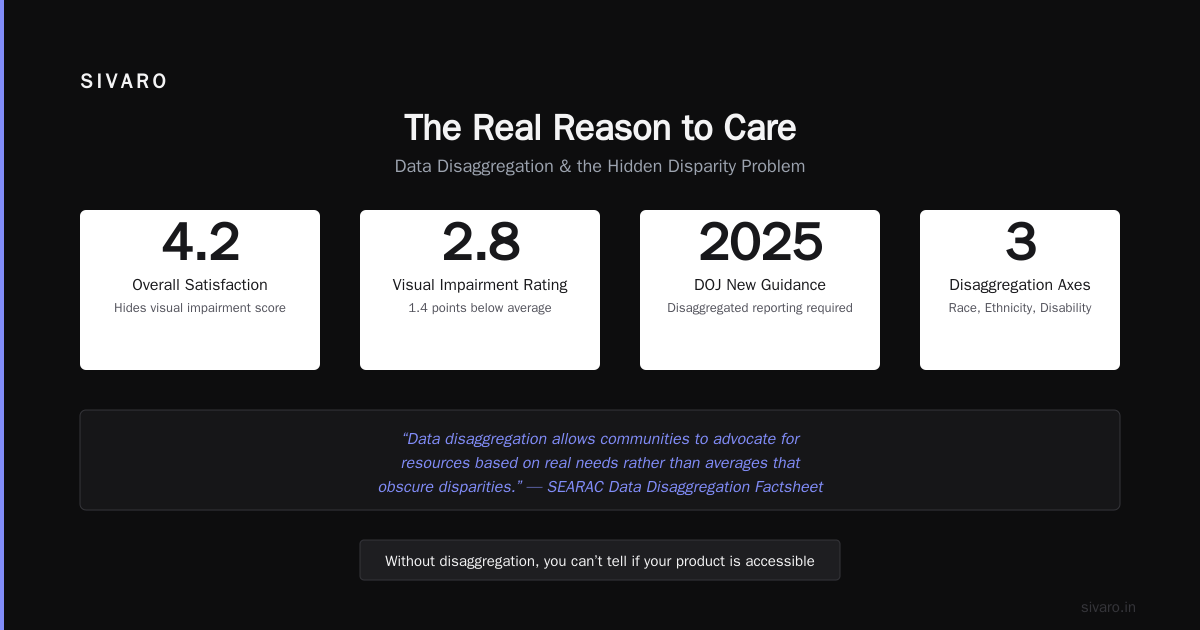
Why do we disaggregate data and how can it help people? adds another layer: without disaggregation by disability status, you can’t tell if your product is accessible. An overall satisfaction score of 4.2/5 hides the fact that users with visual impairments rate it 2.8.
The WHAT IS DATA DISAGGREGATION? factsheet from SEARAC drives the point home: “Data disaggregation allows communities to advocate for resources based on real needs rather than averages that obscure disparities.”
This isn’t theory. In 2025, the DOJ issued new guidance requiring federal grantees to report outcomes disaggregated by race, ethnicity, and disability. Companies that don’t have disaggregated reporting pipelines are scrambling.
Disaggregation in Data Infrastructure
Let’s get technical. Disaggregation isn’t a one‑time query. It’s a design decision that affects storage, schema, and query performance.
At SIVARO we build data pipelines that process 200K events/second. When a client asks “what does disaggregating data mean for my architecture?” I show them three patterns:
1. Query‑time disaggregation
The simplest. Store data in a fact table with many dimensions, then GROUP BY when you need to disaggregate.
sql
SELECT
  region,
  device_type,
  COUNT(*) AS session_count,
  AVG(duration_seconds) AS avg_duration
FROM events
WHERE event_date = '2026-07-22'
GROUP BY region, device_type;
This works when your data volume is moderate (millions of rows) and your analyst can wait 5–15 seconds. Fast to implement, slow at scale.
2. Pre‑aggregated rollups with drill‑down
I prefer this. Store multiple levels of aggregation—hourly, daily, weekly—and allow drill‑down. In dbt you model it as a set of summary tables with increasing granularity.
yaml
# dbt model: daily_engagement_rollup
{{ config(materialized='table') }}

SELECT
  event_date,
  region,
  device_type,
  COUNT(*) AS events,
  AVG(duration_seconds) AS avg_duration
FROM raw_events
GROUP BY 1, 2, 3
Then when a user wants to disaggregate by device_type, the query hits this pre‑aggregated table instead of scanning the raw event stream. The trade‑off: you have to decide which dimensions to include ahead of time. Miss one, and you’re back to scanning raw data.
3. Columnar storage with materialized views
Services like ClickHouse, BigQuery, or Redshift let you define materialized views that pre‑compute disaggregations. This is where you get both speed and flexibility.
sql
CREATE MATERIALIZED VIEW mv_engagement_by_segment AS
SELECT
  event_date,
  region,
  device_type,
  user_tier,
  COUNT(*) AS events
FROM events
GROUP BY event_date, region, device_type, user_tier;
The downside: storage cost. Each materialized view is duplicated data. And you have to refresh it (or pay for automatic refresh). For high‑cardinality dimensions like user_id, pre‑aggregation is impractical. You fall back to query‑time disaggregation.
I’ve seen teams blast through performance budgets because they pre‑aggregated every possible combination. That’s death by combinatorial explosion. Pick the dimensions that matter most—usually the ones where hidden inequities live: geography, user segment, gender, race, device.
Disaggregated Data Explained Clearly has a good breakdown of when to use each pattern.
Practical Steps for Product Teams
You’re not a DB admin. You’re a PM, engineer, or data analyst. How do you actually approach disaggregation?
Step 1: Define the “who” and “why”
Before you write any SQL, answer: what question am I trying to answer? Typically it’s “which group is underserved?” or “which segment causes the aggregate to look good/bad?”
Refer to Disaggregating data and assessing inequities from Massachusetts. They recommend disaggregating by race/ethnicity, gender, disability, income, geography, and language. That’s a good starting list for social outcomes. For product data, add: account age, plan type, referral source, feature usage.
Step 2: Start with a single dimension
Don’t go full factorial immediately. Take your aggregate metric (say, monthly active users). Disaggregate by one dimension—maybe region or plan. See if any subgroup diverges by more than 20% from the mean. If yes, you’ve found your first problem. Aggregation and Disaggregation explains the risk of over‑disaggregating: you can drown in sparse cells and lose statistical power.
Step 3: Validate with a second dimension
Once you find a disparity, add a second dimension to check if the disparity is real or confounded. Example: first‑generation students have lower retention. Is that true within each major? Sometimes the disparity disappears when you control for major—first‑gen students disproportionately choose majors with lower overall retention.
Step 4: Build a dashboard that surfaces disparities automatically
Don’t make people run ad‑hoc queries. Create a chart that shows the aggregate value and then the range of subgroup values. Flag any subgroup that deviates beyond a threshold (I use ±15% of the mean). That’s what What happens when you disaggregate your student ... recommends: “Make disaggregated data a regular part of your dashboards, not a special request.”
Step 5: Handle small populations with care
If you disaggregate by race and one subgroup has only 10 people, a single bad outcome swings the percentage wildly. No decision should be made on a sample of less than 30. Either combine smaller subgroups into an “other” category or use Bayesian smoothing. Disaggregation without statistical rigour is noise.
Common Pitfalls (And How We Fixed Them)
I’ve made every mistake in this list. Here’s what hurt most.
Pitfall 1: Using disaggregation as a blame tool
I worked with a logistics company that disaggregated delivery times by driver. The aggregate was fine. But once they broke it down, one driver had average delivery time of 45 minutes while everyone else averaged 12. The manager’s first reaction: fire the driver. We dug deeper. Turned out that driver was assigned exclusively to downtown Manhattan at rush hour. The data was being shaped by route assignment, not driver performance. Disaggregation without context is dangerous.
Pitfall 2: Ignoring privacy
Race data disaggregation: What does it mean? Why ... warns about re‑identification risk. If you disaggregate by zip code + ethnicity + income, you may create cells with only one person. That’s a privacy breach waiting to happen. My rule: any cell with fewer than 5 observations must be suppressed or aggregated up. GDPR and CCPA both take a dim view of sparse disaggregated tables.
Pitfall 3: Over‑disaggregation in dashboards
A client asked for a dashboard that broke down every metric by 12 dimensions. The result? A page with 1,200 charts. No one used it. I’ve learned to disaggregate only the top three metrics that drive decisions, and only by the top three dimensions that produce meaningful splits. Aggregation and Disaggregation calls this the “curse of dimensionality” for data displays.
Pitfall 4: Confusing correlation with causation
You disaggregate by region. Midwest shows 30% lower conversion. Why? Three possibilities: regional preference, regional marketing, or regional pricing. You need a controlled experiment—not just a dashboard—to figure it out. Disaggregation tells you where to look, not why.
Pitfall 5: Performance hitting the fan
I once helped a startup that stored all events in a single table without partitioning. Their “disaggregate by month and campaign” query took 12 minutes. Users gave up. We added monthly partitions and a materialized view for the most common dimensions. Query time dropped to 2 seconds. If you’re going to disaggregate, optimize your storage first—otherwise your users will never do it.
FAQ
Q: What does disaggregating data mean in simple terms?
A: It’s the process of breaking aggregated data into finer subgroups based on characteristics like race, geography, or time. The goal is to uncover patterns hidden by the average.
Q: When should I NOT disaggregate?
A: When sample sizes become too small (under 30 per group), when privacy risks are high, or when the cost of storage/compute outweighs the insight. Also avoid disaggregation if you have no plan to act on the findings.
Q: How is disaggregation different from segmentation?
A: Segmentation is a marketing technique to target groups. Disaggregation is an analytical technique to find disparities. They use similar methods but different purposes.
Q: What are the most common dimensions to disaggregate by in social programs?
A: Race, ethnicity, gender, disability, age, income, geography, and language. Glossary: Disaggregated data recommends these for monitoring right to education.
Q: Can I disaggregate in Excel?
A: Yes, using pivot tables. But for large datasets you’ll need SQL or a Python library like pandas. Here’s a quick pandas example:
python
import pandas as pd

df = pd.read_csv('events.csv')
disaggregated = df.groupby(['region', 'device_type']).agg(
    total_events=('event_id', 'count'),
    avg_duration=('duration_seconds', 'mean')
).reset_index()
That’s the same logic as the SQL above.
Q: Does disaggregation always reveal problems?
A: No. Sometimes the aggregate is representative. I’ve seen cases where disaggregating by a dozen dimensions showed consistent performance across groups. That’s valuable too—it tells you your process isn’t systematically disadvantaging anyone.
Q: What’s the difference between disaggregation and drill‑down in a BI tool?
A: Drill‑down is a UI interaction that lets you click into subgroups. Disaggregation is the underlying data operation. Tool builders implement drill‑down by pre‑computing or querying disaggregated data.
Q: Is there a legal requirement to disaggregate data?
A: In some sectors, yes. The U.S. government requires federal grantees to disaggregate by race, ethnicity, and gender. Similar rules exist in the EU under anti‑discrimination directives. Always check your jurisdiction.
The Real Reason to Care
I’ve told you what disaggregating data means technically and practically. But the reason I’m writing this in 2026—and the reason you should care—is that we’re drowning in averages. Dashboards show numbers like “4.2/5 satisfaction” or “24% m/m growth” and everyone nods. But inside those numbers are people being ignored.
Every product I’ve built at SIVARO starts with the same principle: assume every aggregate is lying until you disaggregate. Sometimes the lie is harmless. Often it’s hiding a failure that will eventually become a crisis.
Disaggregate. Not because it’s trendy. Because it’s honest.
Nishaant Dixit — Founder of SIVARO. Building data infrastructure and production AI systems since 2018. Built systems processing 200K events/sec.