 SIVARO

What Does It Mean to Disaggregate a Population? A Field Guide for Engineers
I spent six months of 2025 helping a health‑tech startup debug their cancer‑risk model. They had 1.2 million patient records, a well‑tuned gradient‑boosted tree, and a false‑negative rate they couldn’t explain. Every week their data scientist would say “the model is 94% accurate.” Every week their clinical team would say “it’s missing every fifth Asian woman over 50.”
That’s when I learned what it really means to disaggregate a population.
Disaggregation is the act of breaking a group — your user base, your patient cohort, your sensor network — into finer subgroups so you can see patterns the averages hide. Most teams think it’s just slicing by a column. They’re wrong. Done poorly, it amplifies bias. Done well, it’s the only way to make AI systems that don’t fail quietly.
In this guide I’ll show you what disaggregation means, why it’s the foundation of trustworthy AI, and exactly how we do it at SIVARO. No theory without scars. No advice I haven’t tested against production data.
What Most People Think Disaggregation Is (And Why They’re Wrong)
Let’s get the textbook definition out of the way: disaggregation means separating aggregate data into its component parts. If your report says “average revenue per customer is $47,” disaggregation might show you that enterprise clients spend $2,100 and free‑tier users spend $0.
That’s not wrong. But it’s dangerously incomplete.
The problem is that most data pipelines treat disaggregation as a reporting exercise — a BI dashboard filter. You pick a column, you filter, you see the numbers. Then you move on. But disaggregation is a design constraint, not a post‑hoc analysis. If you don’t build it into your data infrastructure from day one, you’re building a system that will blind you to its own failures.
I saw this at a fintech company last year. They had a fraud detection model that was 99.2% accurate overall. Great. Then they disaggregated by transaction type: peer‑to‑peer transfers, debit card, wire. The model missed 7% of wire‑fraud attempts. That’s a $4 million problem hiding inside a 0.8% error rate.
They had the data. They just weren’t asking the right questions.
Why Your AI Model Needs Disaggregation More Than It Needs More Data
You can throw ten million records at a model and still get biased results if your training population isn’t representative. AI governance frameworks from IBM and others are now mandating disaggregated evaluation as a core practice. Why? Because aggregate metrics lie.
Here’s a concrete example from my own work. At SIVARO we built a real‑time recommendation engine for a media client. Overall click‑through rate hit 3.1%. Management was thrilled. But when we disaggregated by device type, desktop was 4.5% and mobile web was 1.2%. The mobile experience was broken — slow loading, bad layout. We only saw it because we sliced.
The rule of thumb: if you aren’t measuring performance across at least four demographic or behavioral segments, you’re flying blind.
The EU AI Act guide from Elitmind makes this explicit: data governance must include “representative disaggregation” to avoid systemic bias. That’s not optional anymore.
How We Disaggregate at SIVARO (The Practical Playbook)
I don’t believe in abstract frameworks. Here’s the exact process we use when a client asks us to “disaggregate a population.”
Step 1: Define the meaningful axes — not just the easy ones
Most engineers start with columns they already have: gender, age bucket, country. That’s fine for compliance. It’s terrible for insight.
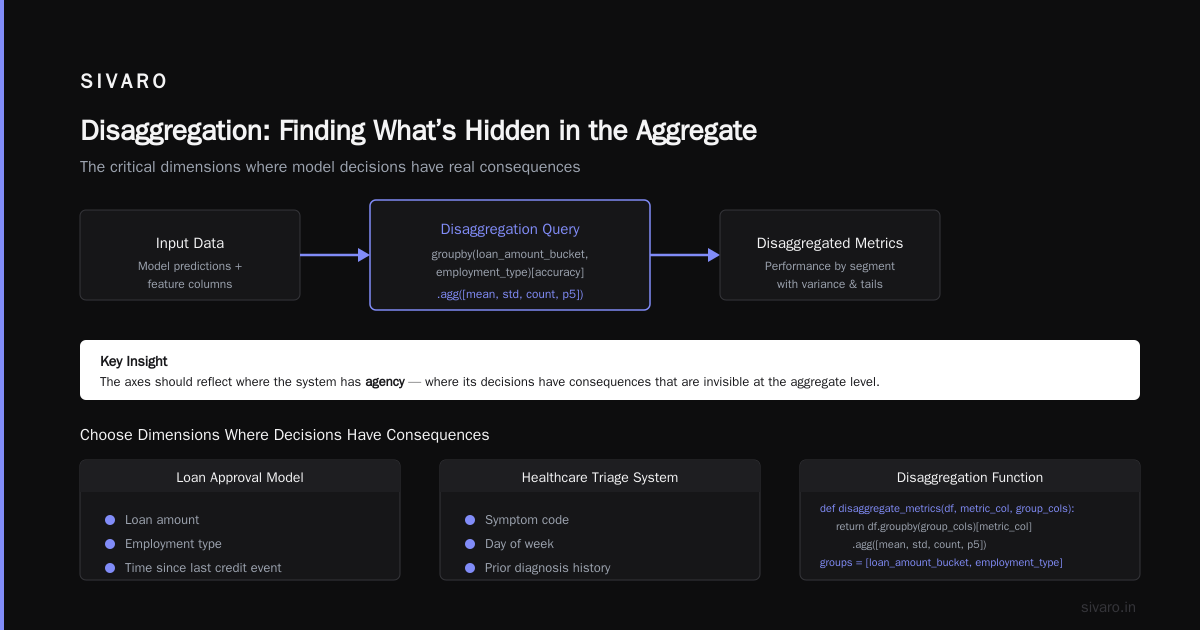
Instead, we ask: What could go wrong in a way that’s invisible at the aggregate level? For a loan approval model, that might be loan amount, employment type, and time since last credit event. For a healthcare triage system, it’s symptom code, day of week, and prior diagnosis history.
The axes should reflect where the system has agency — where its decisions have consequences.
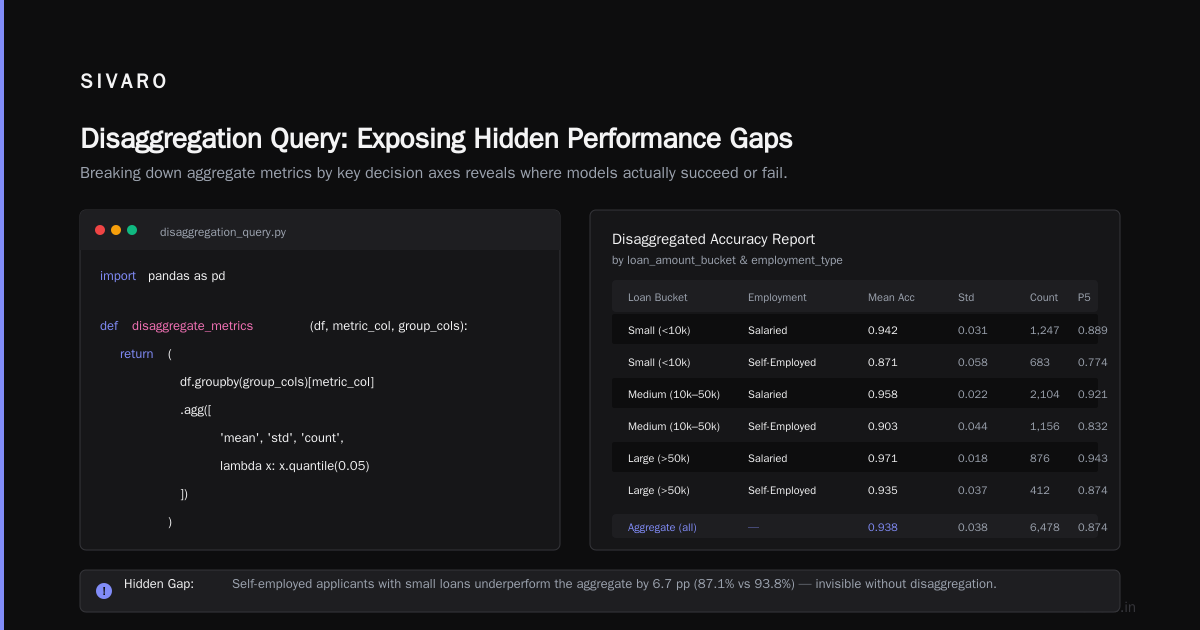
We test this by writing a simple disaggregation query:
python
import pandas as pd

def disaggregate_metrics(df, metric_col, group_cols):
    return (
        df.groupby(group_cols)[metric_col]
        .agg(['mean', 'std', 'count', lambda x: x.quantile(0.05)])
        .rename(columns={'<lambda_0>': 'p5'})
    )

# Example: accuracy by loan_amount_bucket and employment_type
groups = ['loan_amount_bucket', 'employment_type']
report = disaggregate_metrics(model_eval_df, 'error_flag', groups)
print(report[report['mean'] > 0.15])  # flag segments with >15% error
That’s the starting point. But real disaggregation isn’t a single query — it’s a recursive process.
Step 2: Recursive slicing until the signal is stable
We don’t stop after one cut. If we see a high error rate in “small loans / self‑employed,” we slice again by region, by application channel, by income documentation completeness. The goal is to isolate the root cause subgroup.
This is where most teams fall apart. They slice once, see a problem, then jump to a fix. But the slice might be a confound — maybe self‑employed applicants in that bucket disproportionately use a specific document‑upload portal that’s buggy. The fix isn’t to adjust the model; it’s to fix the portal.
At SIVARO we automate this with a tool we call slice‑and‑drill. It’s a recursive aggregation engine that splits until the subgroup size drops below a statistical power threshold (usually 200 samples). It outputs a tree of slices, each with effect size and confidence.
python
def recursive_slice(df, target_col, features, min_samples=200, depth=0):
    if len(df) < min_samples or depth > 5:
        return {'leaf': True, 'n': len(df), 'mean': df[target_col].mean()}
    best_split = None
    best_gain = 0
    for f in features:
        for val in df[f].unique():
            left = df[df[f] == val]
            right = df[df[f] != val]
            gain = abs(left[target_col].mean() - right[target_col].mean())
            if gain > best_gain and len(left) >= min_samples and len(right) >= min_samples:
                best_gain = gain
                best_split = (f, val)
    if best_split is None:
        return {'leaf': True, 'n': len(df), 'mean': df[target_col].mean()}
    f, val = best_split
    left_branch = recursive_slice(df[df[f] == val], target_col, features, min_samples, depth+1)
    right_branch = recursive_slice(df[df[f] != val], target_col, features, min_samples, depth+1)
    return {'split_on': f, 'value': val, 'left': left_branch, 'right': right_branch,
            'gain': best_gain, 'n': len(df)}
This isn’t a model — it’s an audit tool. It reveals the structure your aggregate metrics are hiding.
Step 3: Build disaggregation into the production pipeline
You can’t do all this after the fact. At SIVARO, every model we deploy has a disaggregation monitor — a real‑time sidecar that logs prediction performance across predefined cohorts.
We use a lightweight stream‑processing job (Kafka → Flink → ClickHouse) that maintains running statistics for each cohort. When any cohort’s error rate drifts beyond a threshold, it triggers an alert. Here’s the skeleton:
sql
INSERT INTO cohort_metrics
SELECT
    model_id,
    cohort_name,
    COUNT(*) AS total,
    SUM(CASE WHEN actual != prediction THEN 1 ELSE 0 END) AS errors,
    AVG(confidence_score) AS avg_confidence
FROM predictions_stream
GROUP BY model_id, cohort_name
EMIT CHANGES
HAVING COUNT(*) > 100;
That HAVING clause is critical. You don’t want alerts from cohorts with three samples.
The Data Governance Connection Nobody Talks About
Disaggregation is pointless if your data quality is garbage. SAS’s AI governance framework rightly insists on data lineage and validation. If you’re slicing by a field that’s 30% null or consistently mislabeled, your subgroups are noise.
I once saw a team disaggregate a customer‑satisfaction model by “region.” Their region field had been populated by a free‑text address parser that mapped “Brooklyn” to “EUR” (because it thought “B” was a country code). Every subgroup was wrong.
Rule: Before you disaggregate, validate every segment column. At SIVARO we run a data‑quality pipeline that flags fields with >5% null, >10% unknown categories, or >1% anomalous values. We don’t let a model into production if any of its natural disaggregation axes fail that check.
What Transparency Really Means in Disaggregated Systems
OCEG’s piece on AI transparency hits a key point: transparency isn’t just about model explainability. It’s about being able to answer “who was affected and how?” for every decision.
Disaggregation is the mechanism for that answer. If a model denies 8% of applications overall but 22% of applicants from a specific postal code, you need to know. That’s transparency.
But here’s the contrarian take: not every subgroup deserves a separate model. I’ve seen teams build 47 micro‑models for 47 demographic segments, each with its own fragile pipeline. That’s not disaggregation — that’s overfitting to noise.
The trade‑off is real. Disaggregating too finely creates instability; too coarsely creates bias. The sweet spot is cohorts with at least 500 observations and a meaningful business or ethical stake.
When Disaggregation Exposes Uncomfortable Truths
I helped a credit union in 2024 that had a 95% approval rate overall. Their board was proud. Then we disaggregated by zip code. Approval rates ranged from 98% in affluent areas to 63% in lower‑income neighborhoods. Same model. Same algorithm.
The reason wasn’t bias in the model — it was bias in the training data. Fewer loans had been made in those zip codes historically, so the model had less confidence there and defaulted to conservative thresholds. The fix wasn’t retraining the model; it was augmenting the dataset with synthetic examples of credit‑worthy applicants from those areas.
That’s the power of disaggregation: it forces you to look at the places your data infrastructure is weak. Domino Data Lab’s definition calls AI governance “the processes and guardrails that ensure AI systems behave as intended.” Disaggregation is the flashlight that shows you where the guardrails are missing.
The Three Most Common Disaggregation Mistakes
I’ve seen the same errors at almost every company I’ve worked with.
1. Disaggregating after the fact, not during training.
You can’t fix a biased model by slicing its evaluation set. The bias is already baked in. You need to disaggregate your training data, your feature engineering, and your validation splits. At SIVARO we require that every candidate model be evaluated on at least five pre‑defined cohorts before it even enters online testing.
2. Using group size as a proxy for importance.
A cohort with 10,000 samples is statistically stable but may hide a critical 200‑person subgroup that’s being systematically mistreated. Don’t let large numbers lull you into confidence.
3. Treating disaggregation as a one‑time exercise.
Populations shift. A cohort that was balanced in January may become 80% male by July. You need continuous monitoring. Read.ai’s practical guide calls this “drift detection at the cohort level.” We run it every 24 hours.
How Disaggregation Intersects With AI Governance
Every governance framework I’ve read — from Palo Alto Networks to MaibornWolff — agrees on one thing: you cannot govern what you cannot see. Disaggregation makes the invisible visible.
In practice that means:
- Audit readiness: When a regulator asks “how did this model perform on protected groups?”, you have the numbers ready.
- Incident response: When a user complains, you can quickly trace the issue to a specific cohort and decide whether it’s a model bug, a data issue, or an edge case.
- Continuous improvement: You know exactly where to invest retraining resources.
Without disaggregation, AI governance is a checkbox exercise. With it, it’s an operational discipline.
FAQ: Disaggregation in Practice
Q: What’s the minimum sample size for a meaningful subgroup?
A: At least 100 to 200 for descriptive statistics, 500 for any statistical test. Below that, random noise dominates. We use a rule of thumb: subgroup must be large enough that a 10% relative change in error rate would be statistically significant at p<0.05.
Q: Should I disaggregate by every demographic attribute?
A: No. Focus on attributes that (a) the model could discriminate on, (b) business stakeholders care about, or (c) are required by regulation. Adding 20 meaningless slices creates noise and false positives.
Q: How do I avoid “p‑hacking” when searching for biased subgroups?
A: Pre‑register your cohorts. Before any analysis, define the slices you’ll check and the significance threshold. Treat any post‑hoc discovery as a hypothesis for future validation, not a definitive finding.
Q: Can disaggregation hurt privacy?
A: Yes. If subgroups are too small, they can be re‑identified. At SIVARO we never report cohort metrics for groups smaller than 50 individuals, and we always aggregate or blur any cell with less than 10 records.
Q: What if my data doesn’t have demographic columns?
A: Use proxy features — geography, purchase history, behavioral patterns. But be careful: proxies can inherit bias. Always validate against ground truth when possible.
Q: Is there a tool that automates this?
A: We built one internally, but open‑source options like shap and alibi‑detect can help. For production, you need something that runs in real time, not a notebook.
Q: How often should I re‑evaluate my cohorts?
A: At least every time the model is retrained, and daily for drift monitoring. We’ve seen cohort error rates shift by 15% in a week after a marketing campaign changed the user base.
Conclusion: Stop Designing for the Average
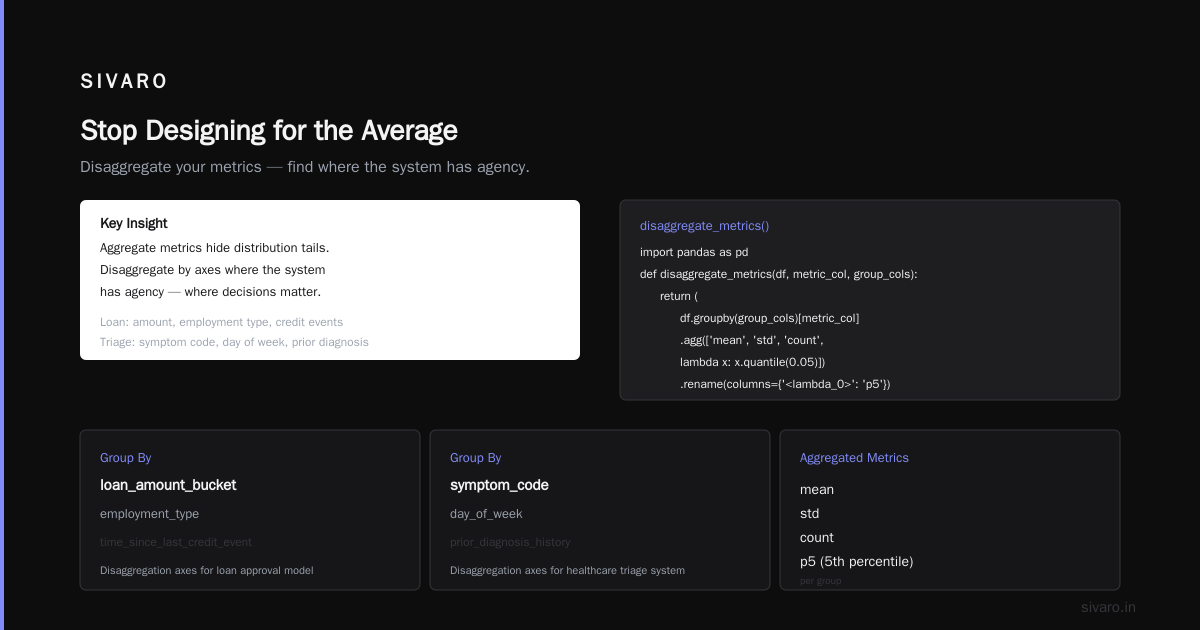
The average user doesn’t exist. The average transaction doesn’t happen. The average patient recovers — but the one who doesn’t is a real person whose data you processed.
Disaggregation is the only honest way to build AI systems. It forces you to confront your blind spots. It makes your governance real. And it’s the only path to earning the trust of the people your models affect.
At SIVARO, we’ve made disaggregation non‑negotiable. Every pipeline, every model, every report. It’s not a feature — it’s a responsibility.
Start today. Pick one metric. Slice it by three meaningful dimensions. Look at the numbers. Then tell me you don’t see something you missed.
Nishaant Dixit — Founder of SIVARO. Building data infrastructure and production AI systems since 2018. Built systems processing 200K events/sec.