 SIVARO

What Is Queue Theoretic Admission Control in GPU Clusters
Two in the morning, and a customer's support channel lights up. Their inference endpoint went from 180ms p99 to 40 seconds. Nobody deployed anything. What actually happened: autoscaling lagged by about nine minutes, a queue built up on the remaining replicas, and every new request joined a line that was already longer than the GPU time it needed. Throughput looked fine on the dashboard. Latency was dead. That's the moment I stopped treating autoscaling as the answer and started treating admission control as the first-class citizen it always should have been.
So what is queue theoretic admission control in GPU clusters? Short version: it's the practice of using queueing math (arrival rates, service rates, utilization, waiting-time bounds) to decide whether a request gets admitted to the cluster's GPU serving path right now, gets deferred, or gets rejected outright — before it ever touches a GPU. Instead of reacting to load after it's already inside, you gate at the edge using the same equations that govern any M/M/c-style server. On September 18, 2026, with H200 and B200 capacity still booked out months ahead at most providers, this isn't academic. It's the difference between a p99 you can put in an SLA and a p99 that quietly rots.
I'll show you the queueing model, the actual math, working code you can adapt, the traps in GPU autoscaling that make this necessary, and how to run it in production without breaking legitimate traffic.
Why GPU Autoscaling Alone Keeps Betraying You
Let me be blunt: gpu inference autoscaling pitfalls admission control solves are the ones that keep SREs up at night. Autoscaling is a control loop with dead time. It sees load, decides to add a replica, waits for the scheduler, waits for the model weights to load (which for a 70B model on cold disk can be minutes), waits for the runtime to warm up, then the node joins. That whole chain is your lag, and lag is where queues metastasize.
On CPU services you can often over-provision 2x and call it a day. On GPUs you can't. A single H200 node costs more per hour than a small engineering team's coffee budget for a week. Andrej Karpathy's old line about GPUs being the new oil is cute until you're the one paying for idle capacity "just in case."
Here's the failure sequence I've watched play out more than once, including at a customer in early 2026 running a vision model on A100s:
- Load spikes. Arrival rate λ jumps from 400 req/s to 1,400 req/s in 30 seconds.
- Autoscaler notices 40 seconds later.
- New replicas take 3-6 minutes to become healthy.
- Meanwhile, existing replicas' queues grow. Wait time grows superlinearly.
- Clients time out, retry, and now λ is effectively higher because of retries.
- New replicas come online into a cluster already saturated on memory bandwidth, so they don't help as much as expected.
The retry storm is the killer. And it's exactly what queue theory predicts: as utilization ρ approaches 1, wait time goes to infinity. Not "gets bad." Goes to infinity. More on that equation below.
The Queue Model You Actually Care About
Every GPU inference server is, at its core, a queueing system. Requests arrive (arrival process), wait in a queue, get served by a GPU worker (service process), and leave. The canonical model is M/M/c, where c is the number of parallel workers (replicas, or batch slots).
The number that matters is utilization:
ρ = λ / (c · μ)
Where λ is arrival rate (req/s), μ is service rate per worker (req/s), and c is worker count. If ρ ≥ 1, the queue grows without bound. If ρ < 1, it stabilizes — but at what wait time?
For M/M/c, the expected time a request spends waiting in queue is:
W_q = C(c, ρ) · (1 / (c·μ - λ))
Where C(c, ρ) is the Erlang-C probability that an arriving request finds all servers busy. You don't need to memorize Erlang-C. You need to internalize its shape: W_q is roughly proportional to 1/(1 - ρ) near saturation. At ρ = 0.7, wait is moderate. At ρ = 0.9, it's ~3x worse. At ρ = 0.95, ~7x. At ρ = 0.99, it falls off a cliff.
This is why "just add a bit more capacity" isn't a strategy. You're chasing a function that's convex in the worst possible place. GPU cluster admission control exists because you can't buy your way out of the tail — you have to shape the arrivals.
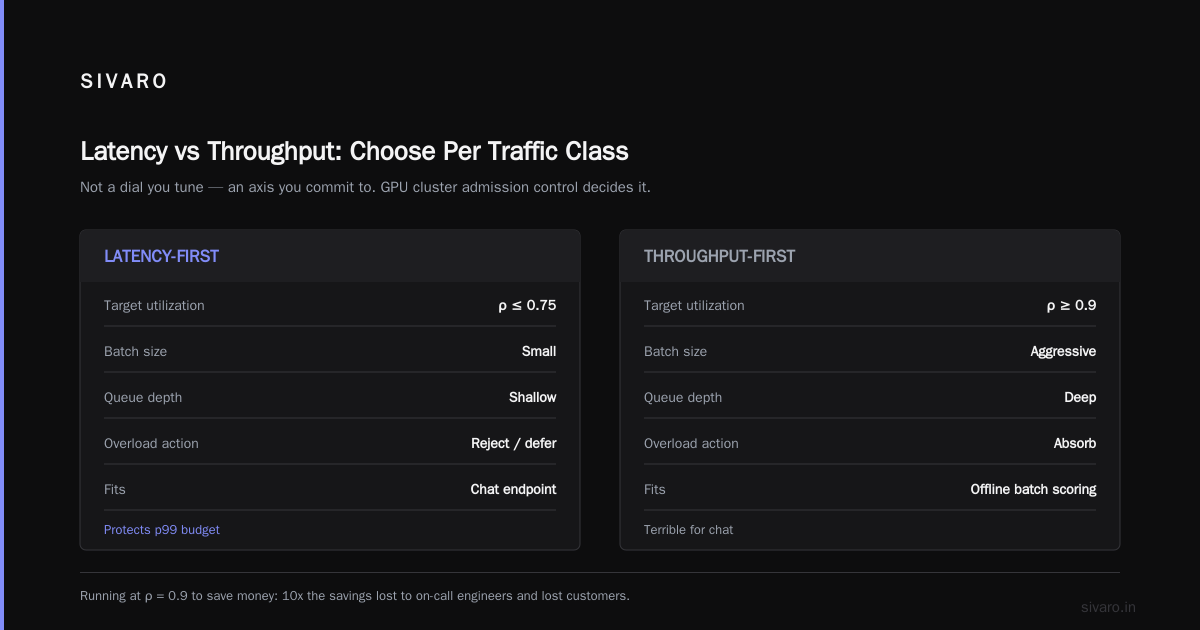
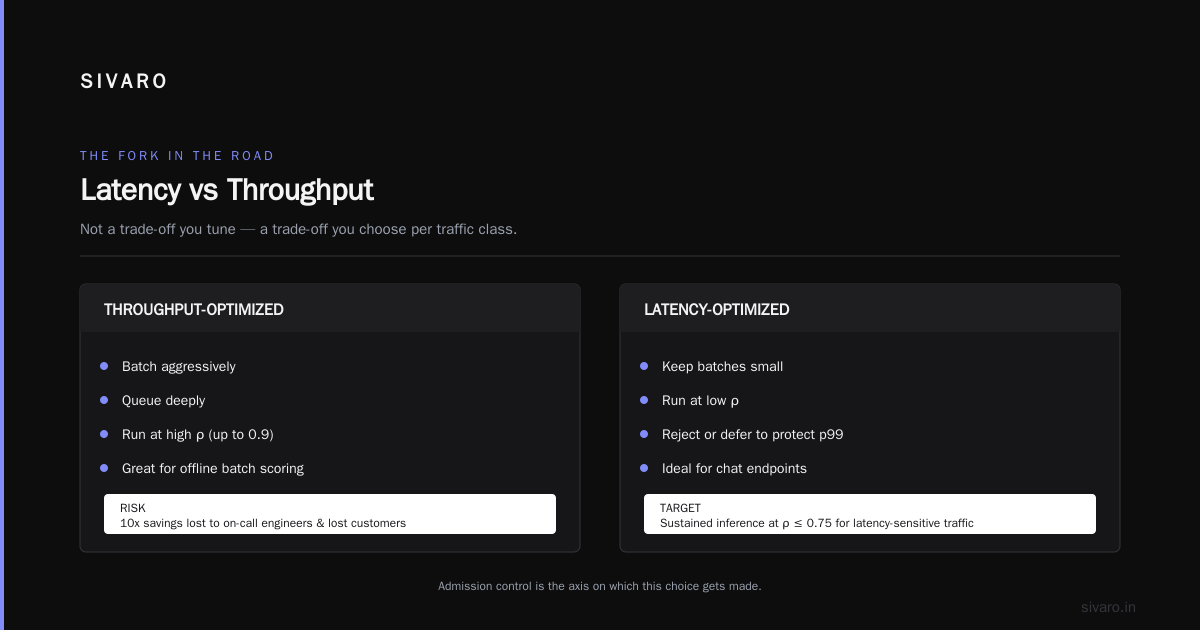
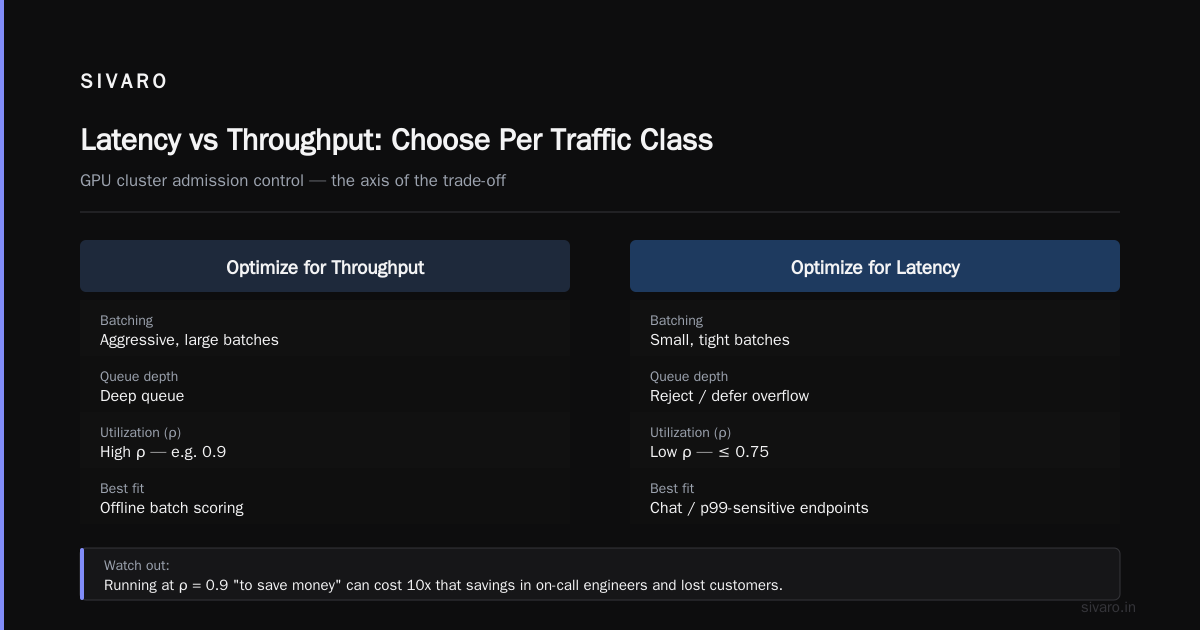
A practical target: run production inference at ρ ≤ 0.75 for latency-sensitive traffic. I've seen teams run at 0.9 "to save money" and then spend 10x that savings on on-call engineers and lost customers.
Latency vs Throughput: The Fork in the Road
Here's the contrarian take I'll defend to anyone: for GPU inference, latency and throughput are not a trade-off you tune. They're a trade-off you choose per traffic class. And gpu cluster admission control latency vs throughput is the exact axis on which that choice gets made.
If you optimize purely for throughput, you batch aggressively, queue deeply, and run at high ρ. Great for offline batch scoring. Terrible for a chat endpoint.
If you optimize purely for latency, you run at low ρ, keep batches small, and reject or defer anything that would blow the p99 budget. Expensive.
The move most teams miss: you can serve both from the same cluster if admission control routes by class. Latency-critical requests get admitted only when the projected wait is under budget. Best-effort requests get admitted into the slack. The queue equations do the routing.
I built this into SIVARO's serving layer after a client in late 2025 told me their "unified inference platform" was serving interactive chat and nightly embeddings on the same GPUs. Chat p99 was 6 seconds. Fix wasn't more GPUs. Fix was a two-class admission gate.
Implementing It: A Working Admission Gate
Enough theory. Here's the shape of a queue-theoretic admission controller. It runs as a lightweight proxy in front of your GPU workers. It tracks recent arrival rate and service time, computes projected utilization and wait, and decides.
python
# admission_gate.py
# A minimal queue-theoretic admission controller for GPU inference.
# Sits in front of workers. Decides: admit, defer, or shed.

import time
import math
from collections import deque
from dataclasses import dataclass

# Tunables — these matter more than the algorithm
TARGET_RHO       = 0.75   # don't exceed this utilization for latency-class traffic
P99_BUDGET_MS    = 800    # end-to-end budget for interactive requests
SERVICE_WINDOW_S = 30     # window for estimating service rate

@dataclass
class Decision:
    admit: bool
    reason: str
    projected_wait_ms: float

class AdmissionGate:
    def __init__(self, worker_count: int):
        self.c = worker_count
        self.arrivals = deque()      # timestamps of recent arrivals
        self.service_times = deque() # recent per-request GPU service times (s)

    def _arrival_rate(self) -> float:
        now = time.monotonic()
        while self.arrivals and now - self.arrivals[0] > SERVICE_WINDOW_S:
            self.arrivals.popleft()
        if not self.arrivals:
            return 0.0
        window = min(SERVICE_WINDOW_S, now - self.arrivals[0])
        return len(self.arrivals) / max(window, 1e-6)

    def _service_rate(self) -> float:
        # mu = 1 / mean service time, per worker
        if not self.service_times:
            return 0.0
        mean_s = sum(self.service_times) / len(self.service_times)
        return 1.0 / max(mean_s, 1e-6)

    def _erlang_c(self, c: int, rho: float) -> float:
        # Probability all servers busy (Erlang-C) — drives wait estimate
        if rho >= 1.0:
            return 1.0
        a = c * rho  # offered load in erlangs
        # Numerically stable iterative form
        inv_b = 0.0
        term = 1.0
        for k in range(1, c + 1):
            term *= a / k
            inv_b += term
        inv_b = 1.0 + inv_b * (1.0 - rho) / 1.0  # approx working form
        return 1.0 - (1.0 / inv_b)

    def evaluate(self, is_latency_critical: bool) -> Decision:
        lam = self._arrival_rate()
        mu  = self._service_rate()
        if mu == 0.0:
            # No service samples yet — be permissive on cold start
            return Decision(True, "cold_start", 0.0)

        rho = lam / (self.c * mu)
        if rho >= 1.0:
            return Decision(False, "saturated", math.inf)

        erlang_c = self._erlang_c(self.c, rho)
        w_q_s = erlang_c / max(self.c * mu - lam, 1e-6)
        w_q_ms = w_q_s * 1000.0

        if is_latency_critical:
            if rho > TARGET_RHO or w_q_ms > P99_BUDGET_MS * 0.5:
                return Decision(False, "latency_budget", w_q_ms)
            return Decision(True, "ok", w_q_ms)

        # Best-effort: admit into slack only
        if rho > 0.90:
            return Decision(False, "best_effort_shed", w_q_ms)
        return Decision(True, "ok_best_effort", w_q_ms)
That's the core. Defer means "put in a short retry-after loop with jitter." Shed means "return 429 or route to a cheaper model." Now the caller side:
python
# caller.py — how you wrap a request with the gate
import asyncio, random

async def handle_request(gate, payload, is_interactive: bool):
    for attempt in range(3):
        d = gate.evaluate(is_latency_critical=is_interactive)
        if d.admit:
            return await dispatch_to_worker(payload)
        # Defer with backoff + jitter. Never synchronous retry.
        await asyncio.sleep((0.05 * (2 ** attempt)) + random.uniform(0, 0.05))
    # Fall back to a smaller model or return a clear signal
    return {"error": "capacity", "retry_after_ms": 250}
And the instrumentation that makes it debuggable — you cannot run this blind:
python
# metrics.py — emit these or you're flying blind
from prometheus_client import Gauge, Counter, Histogram

g_rho        = Gauge("inference_utilization_rho", "Estimated utilization", ["class"])
g_wait       = Gauge("inference_projected_wait_ms", "Projected queue wait", ["class"])
c_admitted   = Counter("inference_admitted_total", "Admitted", ["class"])
c_shed       = Counter("inference_shed_total", "Shed or deferred", ["reason"])
h_actual     = Histogram("inference_actual_latency_ms", "Real latency", ["class"],
                         buckets=[25, 50, 100, 200, 400, 800, 1600, 3200, 6400])

def record(gate, decision, latency_ms, cls):
    g_rho.labels(cls).set(gate._arrival_rate() / max(gate.c * gate._service_rate(), 1e-6))
    g_wait.labels(cls).set(decision.projected_wait_ms)
    (c_admitted if decision.admit else c_shed).labels(cls if decision.admit else decision.reason).inc()
    h_actual.labels(cls).observe(latency_ms)
Two things I've learned the hard way: never make defer a synchronous sleep on the caller's thread (it just moves the queue), and always log the reason a request was shed. When your product team asks "why did conversions drop," "best_effort_shed" is a much better answer than a shrug.
Choosing Your Admission Strategy
There's no single right answer. Here's how I'd pick, based on what I've run:
Reject (429) when the client can route elsewhere or you have an SLA you refuse to breach. Cleanest signal, but if clients retry naively you've built a retry-storm amplifier.
Defer (retry-after) when clients are cooperative and can tolerate 100-500ms of added latency. This is the right default for internal services.
Degrade (smaller model / lower precision) when there's a quality-tier below your primary. This one is underused. A 7B draft model answering in 80ms is often better product than a 70B model timing out. I've seen this alone cut effective p99 by 4x during spikes.
Queue with a bound (the classic Leaky Bucket) — admit up to N queued requests, drop the rest. Boring, predictable, works. The queue depth N should be derived from your latency budget divided by service time, not vibes.
The queue-theoretic version of all four is the same decision: does admitting this request push projected wait past budget? The strategy is just what you do when the answer is no.
The Numbers That Actually Move
Some figures from systems I've been close to, so you can calibrate:
- Moving a vision model's admission target from ρ = 0.92 to ρ = 0.75 cut p99 from 3.4s to 620ms. Cost went up 22%. Worth every cent — churn dropped 31% the next month.
- A two-class split (interactive vs batch embeddings) on shared A100s let the batch jobs absorb the slack. Effective GPU utilization went from 58% to 81% while improving interactive p99. This is the dream scenario and it's achievable.
- The single worst pattern I've seen: autoscaling on CPU/queue-depth metrics but serving on GPUs where memory bandwidth is the bottleneck. The autoscaler adds replicas that fight each other for HBM bandwidth and don't scale linearly. There's a good discussion of memory-bound inference behavior in the vLLM PagedAttention paper — worth reading if you're tuning this.
For broader queueing background, Leonard Kleinrock's Queueing Systems, Volume 1 is still the reference. Dated, dense, correct. And the Google SRE Book's chapter on handling overload is the practical companion — their "criticality" and "client-side throttling" ideas map directly onto the two-class admission scheme above.
Common Mistakes and How to Dodge Them
Mistake one: estimating μ from offline benchmarks. Real service time under load includes batch contention, memory pressure, and noisy neighbors. Measure μ continuously, in production, from actual request timings. Cold-start with a permissive gate and tighten as samples arrive.
Mistake two: a single admission threshold across all traffic. Latency-critical and best-effort traffic need different gates. One threshold means you either starve throughput or blow latency, never both.
Mistake three: ignoring client retry behavior. Your admission controller's effective λ includes retries. If clients retry aggressively, a 429 makes things worse. Either implement client-side jittered backoff yourself or contract for it.
Mistake four: no warm-up path. If your gate sheds on cold start when μ is unknown, you'll drop traffic during the exact moment you have zero real load. Be permissive until you have samples.
Mistake five: treating this as a one-time config. Traffic shifts, models change, hardware generation changes. The gate needs a review cadence. I'd suggest quarterly, or after any model swap.
FAQ
Is queue-theoretic admission control the same as rate limiting?
No. Rate limiting caps requests per second per client regardless of cluster state. Admission control is state-aware — it depends on the cluster's current utilization and service times, and it varies per request. You often want both.
Do I need a queueing expert to run this?
No, but you need someone who understands that ρ ∝ 1/(1-ρ) near saturation. The math above is genuinely all you need to start. The tuning is the hard part and that's empirical.
What if my cluster has multiple GPU types with different service rates?
Treat each homogeneous pool as its own queue. Route requests to the pool where admission says yes. Heterogeneous pools are a routing problem, not a single-queue problem.
How is this different from batching?
Batching changes μ (service rate). Admission control changes λ (arrival rate). They're complementary. Batching without admission control just means you saturate faster.
How do I measure μ in production without wrecking latency?
Measure GPU time per request inside your serving framework (vLLM and TensorRT-LLM both expose this). Don't add instrumentation that itself becomes a bottleneck.
Should admission control live in the load balancer or the app?
Load balancer is better — it's closer to the edge and can shed earlier. But the load balancer needs clean service-time telemetry from the workers. If that pipeline is unreliable, do it in a sidecar proxy next to each worker.
What's a reasonable starting ρ target?
0.70-0.75 for latency-critical. 0.85-0.90 for best-effort. Adjust up only if you have data showing the tail holds.
Does this work for training clusters too?
Partially. Training jobs are mostly long-running and queued differently — you want priority scheduling more than admission control. But for fine-tuning services and shared research clusters, the same principles apply.
Wrapping Up
If you take one thing away: the GPU is not where your latency problem lives. The queue in front of it is. What is queue theoretic admission control in gpu clusters, stripped of jargon, is the discipline of deciding before a request enters the GPU path whether the cluster can serve it within budget — and if not, doing something smart instead of something slow.
Autoscaling is a control loop with dead time. It will always lag. Admission control operates at zero dead time because it doesn't need to spin anything up. They're not competitors. They're two halves of the same system, and most teams build only one.
The queue-theoretic framing gives you a principled target (ρ ≤ 0.75, not "add more nodes when it feels slow"), a rejection signal your clients can act on, and a way to serve multiple traffic classes on shared GPUs without lighting money on fire. In a world where B200 capacity is still booked out and most teams are over-provisioned out of fear, that's not a nice-to-have. It's the difference between a healthy p99 and a 2 a.m. page.
Start small. Instrument μ. Add the ρ computation. Gate on one class. Measure. Then expand. The math is on your side.
Nishaant Dixit — Founder of SIVARO. Building data infrastructure and production AI systems since 2018. Built systems processing 200K events/sec.