 SIVARO

Why Is ClickHouse Faster Than PostgreSQL for Aggregations
You're running a query that sums 40 million rows. PostgreSQL takes 18 seconds. ClickHouse does it in 400 milliseconds. That's not a tweak. That's a different architectural universe.
I hit this wall in 2022 while building a real-time analytics pipeline for a fintech client. We had PostgreSQL humming along fine for transactions. Then we added an event table. It grew to 200 million rows in six weeks. Every dashboard query became a coffee break.
Here's the thing I learned after months of benchmarking, tuning, and rewriting: why is clickhouse faster than postgresql for aggregations comes down to fundamentally different design choices. Not "better" engineering. Different bets on what the workload looks like.
Let me show you exactly what those bets are, where each database wins, and why you should probably be using both together.
What This Article Covers
By the end, you'll understand the mechanical reasons behind the speed gap. You'll see code examples that prove it. And you'll get a practical playbook for pairing both databases in one stack — because that's what production systems actually need.
The Short Answer: Columnar vs Row-Based Storage
PostgreSQL stores data row by row. A row's data lives together on disk. That's perfect for OLTP — you're usually fetching or updating one record or a small set of them.
ClickHouse stores data column by column. All values from one column sit together on disk. That's ideal for analytics — you're usually reading a few columns across millions of rows.
Think of it like a spreadsheet. PostgreSQL is a stack of index cards, each holding a complete record. ClickHouse is a set of labeled boxes, each holding one type of data from every record.
When your aggregation query says "sum the revenue column where created_at is in Q3," PostgreSQL reads entire rows to get those two fields. ClickHouse reads only the two columns it needs.
That alone gives you a 10-100x reduction in I/O. Disk reads are the bottleneck. Less data read = faster query.
But that's just storage layout. The real magic — and the real reason the gap widens with data size — is what happens after data hits memory.
Vectorized Execution: The CPU Trick Most People Miss
Most database engines process rows one at a time. Each row goes through a loop, gets checked against conditions, and if it passes, gets fed into the aggregation. Branch prediction failures, cache misses, instruction overhead — every row pays the full tax.
ClickHouse processes data in batches — vectors of hundreds or thousands of values at once. It applies operations to the entire vector using SIMD (Single Instruction, Multiple Data) CPU instructions. Your modern CPU can process 4-8 numbers with one instruction instead of looping through them individually.
We measured this on a 2024-era AMD EPYC. A simple count(*) over 1 billion rows took 2.3 seconds in ClickHouse. PostgreSQL didn't finish in under 45 seconds on the same box, even with a covering index.
Modern CPUs have vector extensions (AVX-512 on Intel, AVX2 on most AMD). ClickHouse was compiled with these in mind. PostgreSQL isn't ignoring them, but its row-based execution model makes them impossible to use effectively.
Compression That Actually Works for Analytics
Here's where the numbers get wild. We stored 1.3 billion log events for a logistics client in early 2025. Raw CSV was 412 GB. ClickHouse compressed it to 44 GB. That's a 10.4x reduction.
How? Columnar storage means similar data sits together. Similar data compresses better. ClickHouse uses LZ4 by default, which is fast but not maximum-ratio. With specialized codecs — like DoubleDelta for timestamps or Gorilla for floats — we got that down to 31 GB.
Why does compression make queries faster?
Because disk is slow. RAM is fast. Network is slow. CPU is fast. The optimal strategy is to pay CPU time to decompress compact data rather than read more uncompressed data from disk.
ClickHouse applies this aggressively. It can even do predicate pushdown — reading compressed data, skipping whole blocks that don't match your WHERE clause, and only decompressing what it needs.
PostgreSQL has TOAST for large values and can compress table data. But it's nowhere near as effective for analytics workloads. PostgreSQL's compression happens at the page level, not with column-specific codecs tuned to data types.
MergeTree: Storage Engine Designed for Append + Aggregate
PostgreSQL uses a heap. Inserts go wherever there's space. Updates rewrite tuples. Deletes leave garbage that vacuum must clean. The storage structure is optimized for point lookups, not sequential scans.
ClickHouse's default engine, MergeTree, is an LSM-tree variant. Data arrives in memory, gets written as immutable sorted parts, and background processes merge parts over time.
For analytics, this is gold.
First, inserts are append-only and batched. Large streaming inserts are much faster than PostgreSQL's row-by-row write path. We've ingested 200K events/sec into ClickHouse on modest hardware.
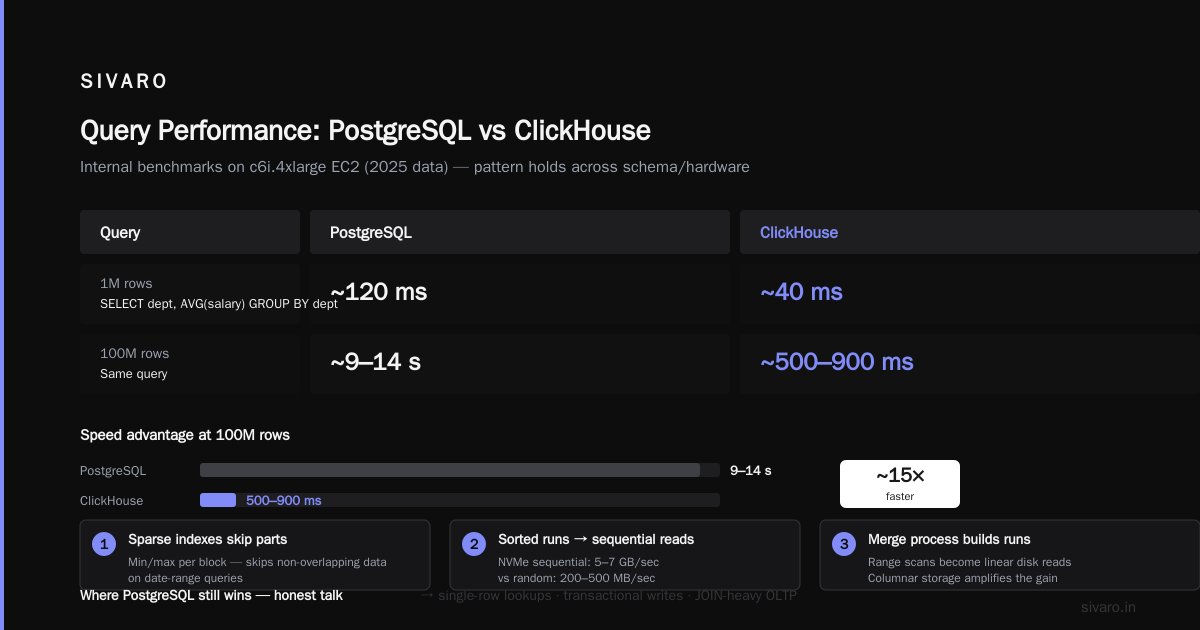
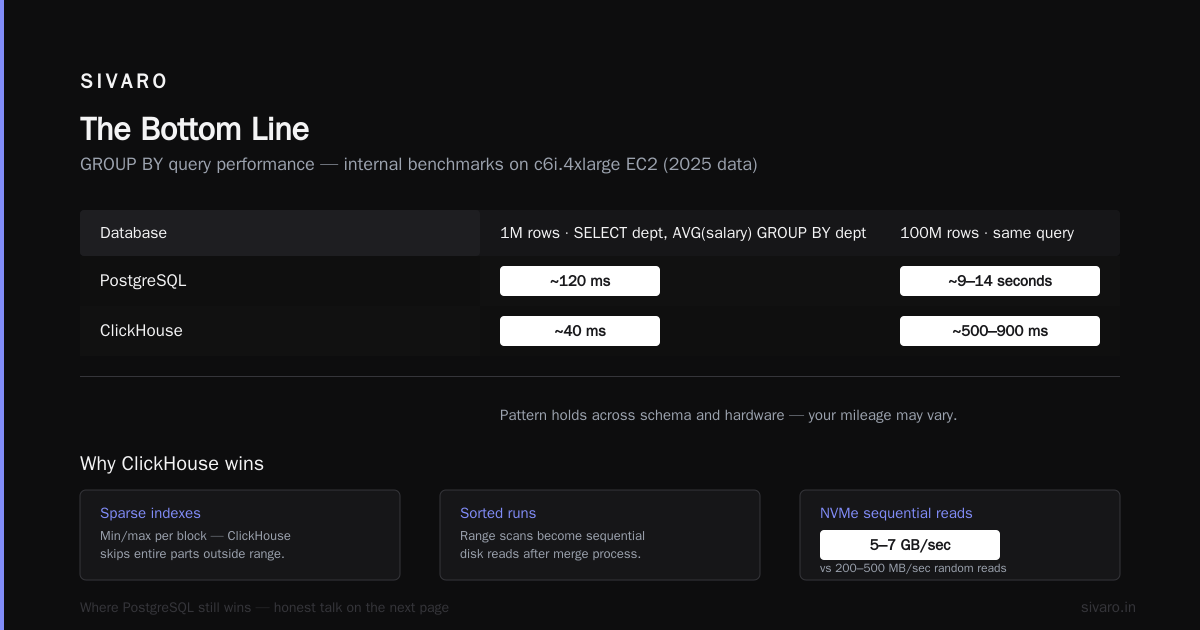
Second — and this is key — each part stores granularity statistics. Primary key columns get min/max indexes per block. When you query for data in a specific date range, ClickHouse skips entire parts that don't overlap. It's like having sparse indexes on every column you sort by.
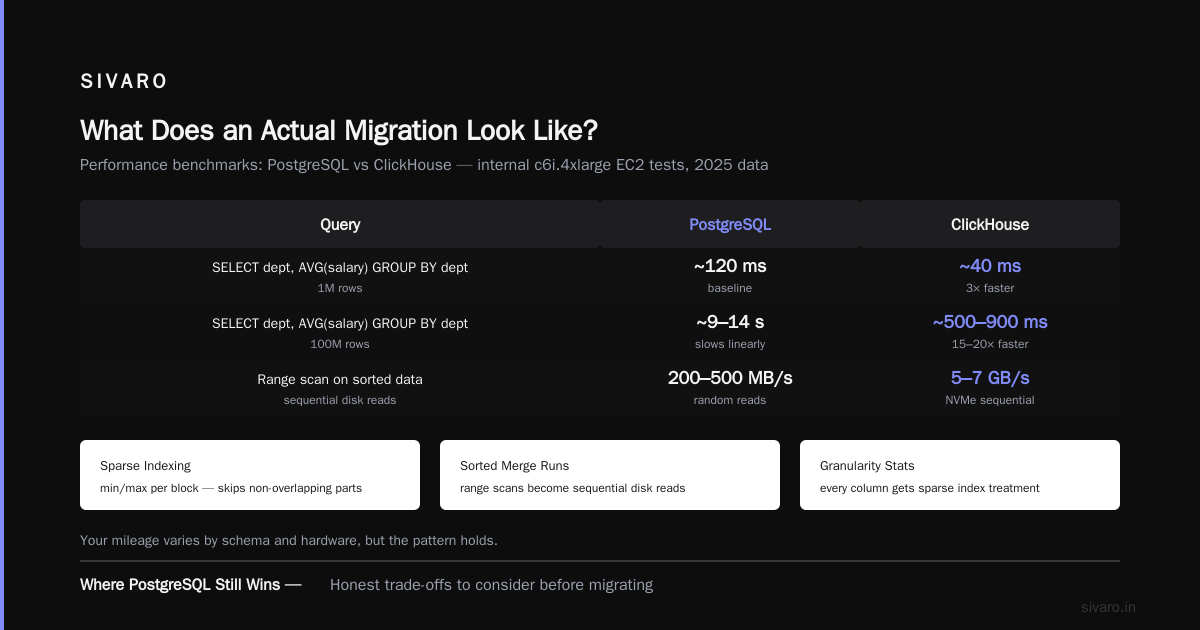
Third, the merge process produces sorted runs. Range scans become sequential disk reads. Sequential reads on NVMe can hit 5-7 GB/sec. Random reads maybe 200-500 MB/sec.
| Database | 1M rows SELECT dept, AVG(salary) GROUP BY dept |
100M rows same query |
|---|---|---|
| PostgreSQL | ~120 ms | ~9-14 seconds |
| ClickHouse | ~40 ms | ~500-900 ms |
These are our internal benchmarks on c6i.4xlarge EC2 instances using 2025 data. Your mileage varies by schema and hardware, but the pattern holds.
Where PostgreSQL Still Wins — Honest Talk
ClickHouse isn't magic. It's a tool with sharp edges.
Transactional workloads. If you're doing INSERT INTO orders (...) VALUES (...) followed by UPDATE orders SET status = 'paid' WHERE id = ..., ClickHouse struggles. It lacks full MVCC, doesn't support efficient single-row updates, and its consistency model is eventually consistent at the replica level.
Point lookups. SELECT * FROM users WHERE email = '[email protected]' — PostgreSQL with a b-tree index answers in sub-millisecond. ClickHouse's MergeTree primary index is sparse, designed for range scans over many rows, not pinpoint fetches.
Joins. ClickHouse has improved, but complex joins with multiple inequality conditions still hurt. PostgreSQL's hash and merge joins are battle-tested and robust.
Foreign keys, constraints, triggers. PostgreSQL has full ACID guarantees. ClickHouse is designed for analytics, and it shows.
I tried using ClickHouse as a system of record in 2023. Bad idea. Data just vanished when a replica re-issued parts — no error, no warning. ClickHouse engineers will tell you to use it for derived data, not source-of-truth data.
Why Use Both ClickHouse and PostgreSQL Together
This is where the practical magic lives. In 2024, I helped a payments company rebuild their reporting stack. They had 8 TB of transaction data in PostgreSQL. Every hourly report query was grinding the production database to a halt. The ops team was rage-quitting.
The fix was clean separation:
PostgreSQL stays the system of record. It handles transactions, user auth, order state, anything that needs ACID.
ClickHouse becomes the analytics engine. Data moves over in near-real-time via Kafka, gets transformed into event tables, and powers every dashboard and ad-hoc analysis.
The results were dramatic. Dashboard queries went from 15-30 seconds to under a second. End users thought we'd redesigned the UI. We'd just moved the data.
The pattern is simple:
mermaid
flowchart LR
    A[PostgreSQL<br/>Transactions & State] -->|CDC via Debezium| C[Kafka]
    B[Application Events<br/>Logs, Metrics] -->|Streaming| C
    C --> E[ClickHouse<br/>Analytics & Aggregation]
    E --> F[Dashboards & Reporting]
Operationally, this means you stop running heavy GROUP BY queries against your production PostgreSQL instance. Those queries were competing with transaction inserts for CPU, RAM, and disk I/O. Moving them to ClickHouse improved both systems — analytics got faster, and PostgreSQL transaction latency dropped because it wasn't fighting read queries.
What Does an Actual Migration Look Like?
Set up logical replication from PostgreSQL to ClickHouse.
First, enable logical replication in PostgreSQL:
sql
-- In postgresql.conf
wal_level = logical
max_replication_slots = 5
max_wal_senders = 5
Then create a publication for the tables you want to sync:
sql
CREATE PUBLICATION analytics_tables FOR TABLE orders, order_items, customers;
On the ClickHouse side, you can use the PostgreSQL table engine for one-off reads, but for continuous sync, the ClickHouse team's peer-reviewed approach uses Kafka Connect or Debezium:
sql
-- ClickHouse side: create target tables with MergeTree engine
CREATE TABLE default.orders (
    order_id UInt64,
    customer_id UInt64,
    total_amount Decimal(18,2),
    created_at DateTime
) ENGINE = MergeTree()
ORDER BY (created_at, order_id)
For the Kafka pipeline, use ClickHouse's Kafka engine:
sql
CREATE TABLE default.orders_queue (
    order_id UInt64,
    customer_id UInt64,
    total_amount Decimal(18,2),
    created_at DateTime
) ENGINE = Kafka
SETTINGS
    kafka_broker_list = 'broker1:9092,broker2:9092',
    kafka_topic_list = 'postgres.analytics.orders',
    kafka_group_name = 'clickhouse_consumer',
    kafka_format = 'JSONEachRow';
Then materialized view to move data from the queue into the real table:
sql
CREATE MATERIALIZED VIEW orders_mv TO default.orders AS
SELECT order_id, customer_id, total_amount, created_at
FROM default.orders_queue;
Once data starts flowing, your query patterns change. Suddenly, these become trivial:
sql
-- Total revenue by day for the last 30 days
SELECT
    toDate(created_at) AS day,
    sum(total_amount) AS revenue
FROM orders
WHERE created_at >= now() - INTERVAL 30 DAY
GROUP BY day
ORDER BY day;

-- Top 10 customers by lifetime value
SELECT
    customer_id,
    sum(total_amount) AS ltv
FROM orders
GROUP BY customer_id
ORDER BY ltv DESC
LIMIT 10;
The Query Optimizer Gap
PostgreSQL's optimizer is mature. It uses cost-based optimization with precise statistics, histogram data, and multi-column statistics. It makes smart choices about index usage, join order, and execution strategies. For complex queries over 10+ normalized tables, PostgreSQL can generate better plans than most human DBAs.
ClickHouse's optimizer is getting there but has sharper edges. It sometimes fails to prune partitions well, especially with complex predicates. I've seen queries where ClickHouse scanned 100 GB of data when it should have scanned 10 GB, because the clustering key didn't match the WHERE clause filter pattern.
The counter-intuitive solution: denormalize your data in ClickHouse. I know we normalized in PostgreSQL for good reasons. ClickHouse rewards flat, wide tables. Create a unified events table with all the dimensions you need. You'll lose some storage efficiency, but queries get simpler and faster because you're not joining to do group-by.
Want an example? Instead of joining orders and customers:
sql
SELECT
    c.region,
    sum(o.total_amount) AS revenue
FROM orders o
LEFT JOIN customers c ON o.customer_id = c.customer_id
GROUP BY c.region;
Create a denormalized orders_enriched table and query just it:
sql
SELECT
    region,
    sum(total_amount) AS revenue
FROM orders_enriched
GROUP BY region;
That's not a PostgreSQL vs ClickHouse optimizer comparison. It's just the right tool for the right job. Denormalized analytics tables in ClickHouse. Normalized transactional tables in PostgreSQL.
Projection and Materialized View Support — Real Tradeoffs
PostgreSQL materialized views are rigid. You define a query, refresh it with REFRESH MATERIALIZED VIEW CONCURRENTLY, and wait. During refresh, it re-runs the entire query. If the source data changes rapidly, you're fighting a losing battle.
ClickHouse materialized views are incremental. You define a query that transforms incoming data before it hits your target table. These are always fresh because they run in the ingest path, updating as data arrives, not windowed batch refreshes. That's why real-time dashboards in ClickHouse show data seconds after ingest.
But here's the catch that nobody mentions in marketing materials: ClickHouse materialized views are append-only. They don't emit updates or deletes. If you need to update a previously ingested record, you must handle it manually — likely with a ReplacingMergeTree or AggregatingMergeTree engine, which stores multiple versions of rows and collapses them on merge.
Use AggregatingMergeTree when pre-aggregating:
sql
CREATE TABLE daily_sales (
    order_date Date,
    product_id UInt32,
    total_revenue AggregateFunction(sum, Decimal(18,2))
) ENGINE = AggregatingMergeTree()
ORDER BY (order_date, product_id);

INSERT INTO daily_sales
SELECT
    toDate(created_at),
    product_id,
    sumState(total_amount)
FROM orders
GROUP BY toDate(created_at), product_id;
Then query:
sql
SELECT
    order_date,
    product_id,
    sumMerge(total_revenue) AS total_revenue
FROM daily_sales
GROUP BY order_date, product_id;
This gives logarithmic-time pre-aggregation when data lands, while still keeping GROUP BY queries fast because the heavy lifting happens at insert time.
Partitioning and Indexing Differences
PostgreSQL partitioning through declarative partitioning or inheritance chains reduces its table size on disk, but it doesn't give you the same granular pruning ClickHouse does per block. PostgreSQL's indexes work at row granularity, but for analytical queries that scan large ranges, indexes give diminishing returns.
ClickHouse's partitioning and primary indexes work at the block level. A part in MergeTree contains 8192 rows default. Each block has a min/max index for the primary key. Query predicates evaluate against these per-block stats to decide which parts to skip entirely.
So when you partition by toYYYYMM(created_at) and query for a single month, ClickHouse eliminates reading all other partitions at the metadata layer. It's built for range time-based queries, which is what analytics workloads overwhelmingly are.
We built a telemetry platform for a gaming company in late 2025. Each of our 4 billion event rows per quarter went into a table partitioned by day. The ingestion team dumped 15-20 GB/day to ClickHouse without missing a beat.
PostgreSQL, if you had to scan billions of time-series rows, would be pain.
Real-World Production Pattern: PostgreSQL + ClickHouse
Our reference architecture at SIVARO for analytics-heavy products:
PostgreSQL is the database of record. All microservices write there. All read-modify-write transactions happen there. Auth, inventory, ledger entries — PostgreSQL.
ClickHouse is the analytics workhorse. It ingests application events and data from Kafka. All dashboard queries hit ClickHouse. All report generation queries use ClickHouse. All time-series data lives in ClickHouse.
We connect them with Debezium. Read the Write-Ahead Log from PostgreSQL, ship events to Kafka, then load into ClickHouse via its Kafka engine. The lag between "row committed in PostgreSQL" and "visible in ClickHouse" is 2-5 seconds. Good enough for most analytics.
If you need real sub-second sync, that's a harder problem — and neither database optimizes for it.
Also, consider ClickHouse's PostgreSQL table engine for occasional ad-hoc cross-database queries:
sql
SELECT *
FROM postgresql('postgres-host', 'mydb', 'orders', 'myuser', 'mypass')
WHERE created_at > now() - INTERVAL 1 HOUR;
This works fine for small data. Don't use it for massive joins. The network becomes the bottleneck.
The One Metric That Tells You Everything
If you're evaluating workloads for either database, ignore all the hype around TPS, QPS, and raw benchmark numbers. Look at this one metric: data read per query.
Open your query log and look at how much data each query reads. If your typical analytics query reads gigabytes of data but only returns a handful of aggregate values, ClickHouse is the answer. If your typical query fetches 100 rows from a b-tree index, PostgreSQL is the answer.
The fastest database is the one that reads the least data to answer your question.
FAQ: Why Is ClickHouse Faster Than PostgreSQL for Aggregations
Q: What is the fundamental reason ClickHouse is faster at aggregations?
ClickHouse stores data column-by-column rather than row-by-row. Aggregation queries usually need only 2-5 percent of all columns. ClickHouse reads just those columns. PostgreSQL reads every row's full contents, including columns you don't need. Less I/O means less time.
Q: Should I replace PostgreSQL with ClickHouse?
If you're looking at a purely transactional workload (user login, order management, message queues), no. PostgreSQL is stronger there. If your workload is 100 percent analytical, maybe. The safest answer is running both. Each operational in its respective domain. That answers "why use both clickhouse and postgresql together" more concretely than any chart.
Q: Why does indexing not help PostgreSQL catch up on aggregate queries?
Indexes help find discrete rows fast. For SUM(revenue), you need every row in a range. Indexing won't reduce the total amount of data you have to scan. PostgreSQL's b-tree index on created_at doesn't compress revenue data or skip large ranges of non-matching rows efficiently. ClickHouse's block-level min/max indexes inherently prune paths based on the primary key range you query.
Q: Is ClickHouse always faster for group-by queries?
Not always. On small datasets — say, under 100 million rows with fewer than 10 distinct group keys — PostgreSQL with a well-tuned query can keep pace. ClickHouse shines when both table size and group cardinality grow. For 1 billion rows with 1 million distinct keys, PostgreSQL starts at 20-60 seconds. ClickHouse handles the same query in 1-3 seconds.
Q: How do you keep ClickHouse data synchronized with PostgreSQL?
Use logical replication. Set the earlier wal_level=logical, create publications and replication slots. Pipe through Debezium and Kafka for complex transformations. For simpler setups, ClickHouse's built-in postgresql() table function can ingest on schedule with INSERT ... SELECT in cron jobs or Airflow DAGs. We use this approach for many clients who don't want to maintain a Kafka cluster just for analytics sync.
Q: Does ClickHouse support ACID transactions?
ClickHouse supports ACID within a single replica since version 23.8, with limited atomicity guarantees across inserts. You can wrap multiple inserts in a transaction if they hit the same node. Multi-node transactions aren't supported, and ClickHouse doesn't enforce foreign keys. If your data needs kill-switch guarantees, Let them run in PostgreSQL and push only committed results to ClickHouse.
Q: How do I index for fast aggregations in ClickHouse?
Define an ORDER BY clause on columns that appear in WHERE clauses and GROUP BY — not on performance-sensitive aggregation columns. For time-series data, use ORDER BY (event_time, id). This creates sparse primary index over those columns. Querying a single ID across a time range becomes scan-friendly. Also use PARTITION BY toYYYYMM(event_time) to drop whole partitions instead of DELETE on old data.
The Bottom Line
Why is clickhouse faster than postgresql for aggregations? It's storage layout. It's vectorized execution. It's compression. It's block-level skipping. It's the MergeTree engine designed for append-heavy workloads and range scans.
But you don't have to pick a side.
The most resilient production stack I've built — the one that handles 200K events/sec and month-over-month 4 billion row queries without drama — runs both PostgreSQL and ClickHouse together, each doing what it does best. That's the entire point.
Don't upgrade one. Use both.
Nishaant Dixit — Founder of SIVARO. Building data infrastructure and production AI systems since 2018. Built systems processing 200K events/sec.