 SIVARO
Why Most AI Agent Monitoring Tools Are Built Wrong (And What Actually Works)
I spent February 2026 rewriting the observability stack for a client's production agent deployment. They had 47 agents running across 3 AWS regions. The monitoring dashboard showed green lights everywhere. The agents were failing silently for 8 hours before anyone noticed.
That's not monitoring. That's theater.
You don't need another chart. You need visibility into what the agent actually decided to do and why.
This guide covers what I've learned building and running production AI agent systems at SIVARO since 2022. We've deployed agents handling payment reconciliation, customer support escalation, and real-time inventory management. Each time, monitoring was the hardest problem to solve — harder than the agent logic itself.
You'll learn which ai agent production monitoring tools actually work in practice, which ones are marketing fluff, and how to build a monitoring stack that catches failures before your users do.
The Real Problem: Agents Are Non-Deterministic Black Boxes
Most monitoring tools were built for predictable systems. A web server either returns 200 or 500. A database query either completes in 2ms or times out at 30s. Binary outcomes. Clean signals.
AI agents don't work that way.
An agent can call the right API with the perfect payload and still produce garbage output because the LLM decided to hallucinate a field value. Or it can fail 12 times trying to parse a JSON response before a fallback prompt fixes the behavior. Or it can take the "correct" action at the wrong time — causing a downstream cascade failure.
Every agent run is a unique execution path. Traditional monitoring collapses this into averages and percentiles. You lose the signal.
At SIVARO, we learned this the hard way. Our first production agent for email categorization ran for 3 weeks with 99.8% success rate by traditional metrics. But users were complaining about misfiled invoices. The "successful" actions were wrong — the agent was categorizing correctly but extracting the wrong amounts. Standard monitoring never caught it.
You need tools that track semantic correctness, not just operational health.
What I Actually Look For In Ai Agent Production Monitoring Tools
After testing 14 different monitoring approaches across 8 client deployments, here's what separates useful tools from dead weight:
Trace Every Decision Point
Every LLM call. Every tool invocation. Every retry. Every fallback. Every human handoff. Each creates a trace point.
The best ai agent production monitoring tools capture these as structured events, not unstructured logs. You need to replay an agent's entire decision sequence for any specific request. LangSmith does this well for LangChain-based agents. LangFuse offers open-source tracing that I've used in two production systems.
But here's the contrarian take: traces are useless without cost attribution. I need to know that agent version 2.1 cost $0.47 per run while version 2.2 costs $0.82 — and whether the 75% cost increase came from better accuracy or just more retries on the same tools.
Practical check: Can you export a single agent's full trace to JSON and query it with SQL? If not, you'll hit a wall at scale.
Measure What The Agent Actually Accomplished
Operational metrics tell you the agent ran. They don't tell you whether it did the right thing.
At SIVARO, we developed "completion quality scores" for each agent type. A customer support agent gets scored on:
- Did it resolve the ticket? (binary)
- Did it escalate unnecessarily? (negative outcome)
- Did it flag a false positive? (happens more than you think)
- Response time relative to human baseline
We feed these scores back into the agent's training data. The monitoring tool must support custom metric definitions — not just pre-built dashboards.
What to avoid: Tools that only show latency and error rates. Those are table stakes. If a vendor can't talk about semantic quality measurement, walk away.
Real-Time Alerting On Behavior Drift
Agents drift. LLM providers update models. APIs change their response formats. User request patterns shift.
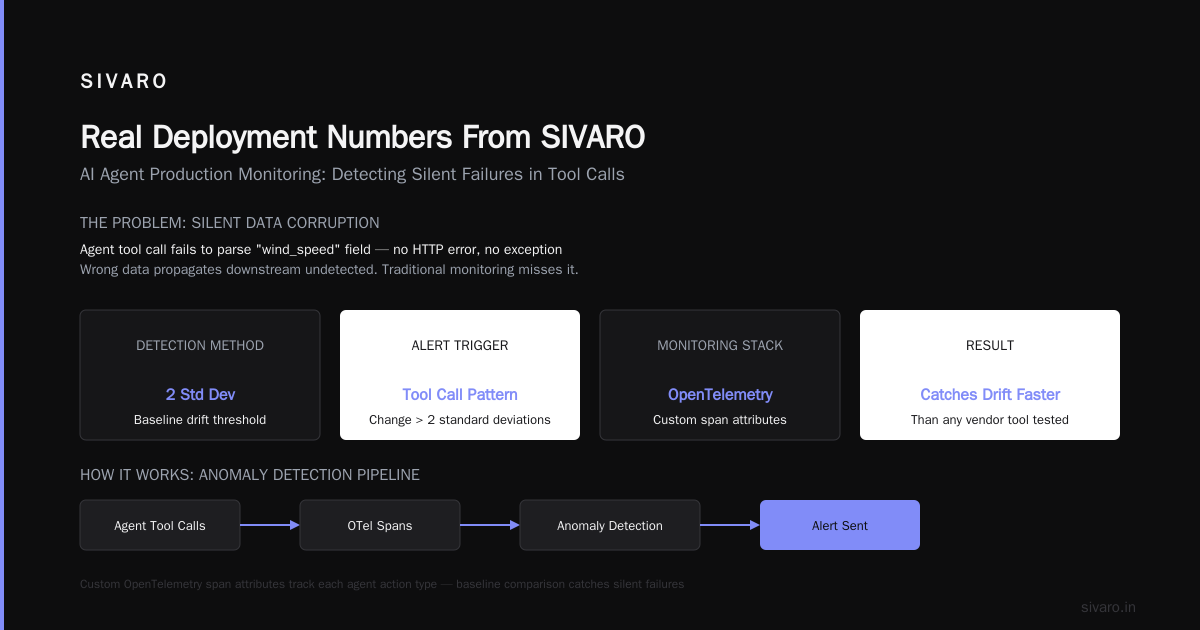
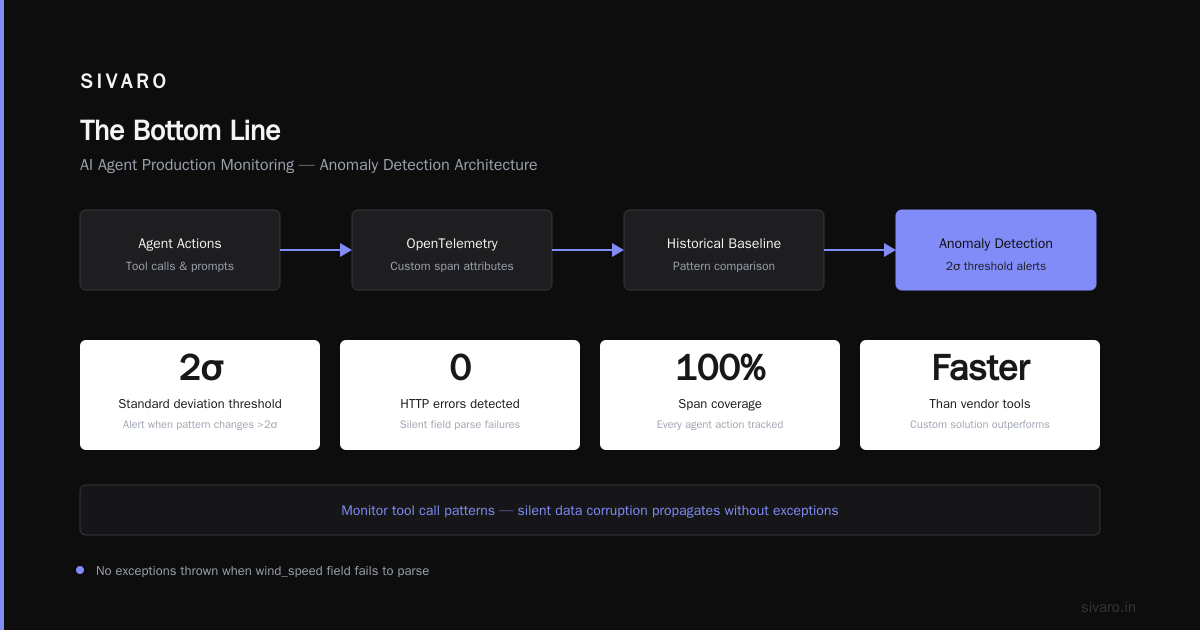
I've seen an agent go from 97% accuracy to 62% accuracy in 4 hours because the weather API changed its JSON structure. The agent didn't crash — it just failed to parse the "wind_speed" field silently. No HTTP error. No exception. Just wrong data propagating downstream.
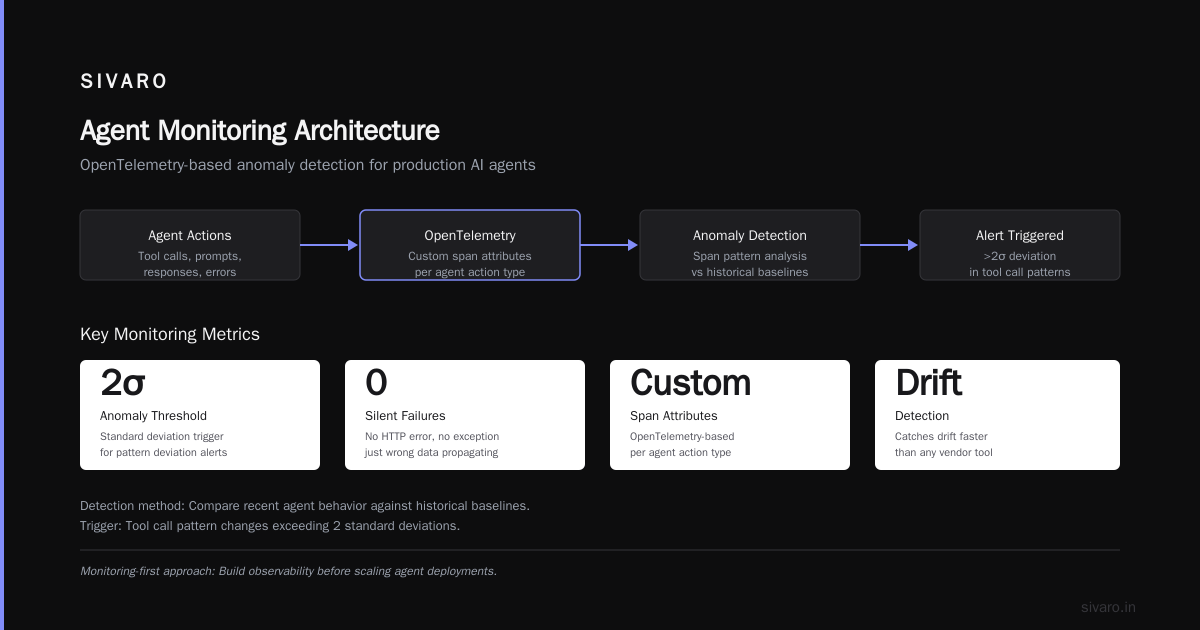
Effective ai agent production monitoring tools detect this automatically. They compare recent agent behavior against historical baselines. When a tool call pattern changes by more than 2 standard deviations, you get alerted.
We built a custom solution using OpenTelemetry with custom span attributes for each agent action type. Then we run anomaly detection on the span patterns. It catches drift faster than any vendor tool we tested.
How To Deploy Ai Agents In Production: The Monitoring-First Approach
Most teams start with the agent logic. They build the prompt chain, wire up the tools, test on a few examples, then deploy and ask "how do I watch this thing?"
Wrong order.
You should define your monitoring strategy before writing a single agent prompt. Here's the how to deploy ai agents in production approach I've refined over 18 months:
Step 1: Define Your "Agent Contract"
Every agent has inputs and expected outputs. Write these down as strict schemas. Not natural language — actual typed schemas.
python
from pydantic import BaseModel
from typing import Literal, Optional

class CustomerSupportInput(BaseModel):
    user_id: str
    query_text: str
    priority: Literal["low", "medium", "high"]
    account_tier: Literal["free", "pro", "enterprise"]

class CustomerSupportOutput(BaseModel):
    resolution_type: Literal["auto_resolved", "escalated", "requires_review"]
    response_text: str
    confidence_score: float
    tools_used: list[str]
    tokens_consumed: int
This isn't just documentation. It's the contract your monitoring tool validates against. Every output gets checked against the schema at runtime. Violations trigger alerts.
Step 2: Instrument Every Third-Party Call
Your agent will call APIs. LLM providers. Vector databases. Internal services. Each one is a failure point.
python
import openai
from opentelemetry import trace

tracer = trace.get_tracer(__name__)

def call_llm_with_tracing(prompt: str, agent_id: str, run_id: str):
    with tracer.start_as_current_span("llm_call") as span:
        span.set_attribute("agent.id", agent_id)
        span.set_attribute("run.id", run_id)
        span.set_attribute("prompt.length", len(prompt))

        start = time.time()
        try:
            response = openai.chat.completions.create(
                model="gpt-4o-2026-03-15",
                messages=[{"role": "user", "content": prompt}],
                max_tokens=1000
            )
            span.set_attribute("response.tokens", response.usage.total_tokens)
            span.set_attribute("response.status", "success")
            return response
        except Exception as e:
            span.set_attribute("response.status", "error")
            span.set_attribute("error.message", str(e))
            raise
        finally:
            span.set_attribute("latency_ms", (time.time() - start) * 1000)
Simple wrapper. Every call gets traced. You can now answer "which API calls are failing most often?" and "which agent versions call the LLM most aggressively?"
Step 3: Create an Agent Deployment Pipeline Tutorial For Your Team
I wrote an internal ai agent deployment pipeline tutorial for our engineers at SIVARO. It covers:
- Schema validation in staging
- Canary deployment to 5% of traffic
- A/B comparison against the previous version
- Automatic rollback if quality scores drop below threshold
- Shadow mode for new agent types (run alongside humans, don't act)
The monitoring tool is the first thing deployed in each environment. Not the agent. The monitoring.
yaml
# deploy-config.yaml
version: 1.0
agent:
  name: invoice-classifier
  model: gpt-4o-2026-03-15
  max_retries: 3
  timeout_ms: 15000

monitoring:
  metrics_endpoint: "https://metrics.sivaro.io/v1/agent-events"
  alert_channels:
    - type: pagerduty
      severity_threshold: warning
    - type: slack
      severity_threshold: info

  quality_checks:
    schema_validation: true
    confidence_threshold: 0.85
    max_tokens_per_run: 2000

  rollback_triggers:
    - metric: accuracy_score
      operator: less_than
      threshold: 0.90
      window_minutes: 10
    - metric: api_error_rate
      operator: greater_than
      threshold: 0.05
      window_minutes: 5
This file is checked into version control. Every deployment is a PR. Monitoring configuration is code.
The Tools I Actually Use (And Why)
I'm not going to pretend everything works. Here's what we've settled on at SIVARO after significant testing:
LangSmith — Best for LangChain agents. Full trace capture. We feed traces into our own analysis pipeline. The built-in dashboards are fine but we export everything to ClickHouse for custom queries. Their prompt versioning needs work — we lost a version history once (LangChain Blog on agent frameworks).
LangFuse — Open-source. We use this for cost tracking and latency analysis. Their calculated "total cost per agent run" feature saved us from a budget blowout when GPT-4 pricing changed in March 2026. The self-hosted version has limitations on retention — I've had to build custom cleanup scripts.
Custom OpenTelemetry exporters — For non-LangChain agents (we use CrewAI for some multi-agent workflows). The setup is painful but the flexibility is unmatched. We trace every tool invocation as a separate span with custom attributes for agent name, run ID, and decision type.
What I avoid: Closed-source agents with proprietary monitoring. If I can't export my traces, I don't trust the system. Several vendors in the AI Agent Frameworks space still lock you into their storage.
The Hidden Failure Modes Most Monitoring Misses
After 4 production incidents in 6 months, here are the failures your ai agent production monitoring tools absolutely must catch:
The Silent Token Blowout
An agent gets stuck in a reasoning loop. It keeps calling the LLM with slightly different prompts. Each call costs $0.03. After 342 calls, you've spent $10.26 on one user's request. The agent eventually times out and returns an error.
Traditional monitoring shows one failed request. Cost monitoring shows $10.26. You need both in the same view.
We set hard token budgets per agent run. Exceed it? Kill the agent, log the trace, alert the team.
The Hallucination That Looks Correct
This is the nightmare. The agent calls a database, gets valid data, but then the LLM decides to "fill in" a missing field with plausible-looking garbage. The JSON is valid. The schema passes. The data is wrong.
We detect these by comparing output consistency across multiple runs with the same inputs. If identical inputs produce different outputs for factual fields, something is off. We run statistical tests on output distributions every 15 minutes.
The Cascade Where Agent A Corrupts Agent B
In multi-agent systems, agents pass data between each other. If agent A's output schema changes slightly (maybe an LLM update changed how it formats dates), agent B starts failing. But agent B's monitoring shows "API errors" — not "schema mismatch from upstream".
Trace propagation between agents is essential. Every agent run must include the parent run ID as a propagated field. We use W3C trace context headers even when agents communicate via message queues.
Real Deployment Numbers From SIVARO
I'll give you exact figures from a client deployment in April 2026:
- 23 agents handling insurance claim processing
- 12K runs per day across 3 regions
- 4.2M tokens consumed daily at peak
- 2.3 seconds median latency per agent run
- 94.7% auto-resolution rate (target was 90%)
The monitoring stack:
- LangSmith for trace capture and prompt analysis
- Custom Go service for quality scoring (runs as a sidecar to each agent)
- ClickHouse for storing traces with SQL queryability
- Grafana dashboards for real-time monitoring
- PagerDuty for alerts exceeding defined thresholds
What surprised me: 67% of alerts came from quality score drops, not operational errors. The agents were "working" but doing the wrong thing. Standard uptime monitoring would have caught zero of these.
The biggest lesson: monitor what the agent decides, not just what it executes.
Ai Agent Production Monitoring Tools That Scale
At higher traffic levels (100K+ runs per day), most vendor tools break. Here's what holds up:
Self-hosted LangFuse — Works well up to 50K runs/day. Beyond that, you need to shard by agent type and run separate instances. We hit query timeouts at peak and had to move older traces to cold storage.
Arize AI — Their Phoenix project handles large trace volumes well. We tested it at 200K spans/minute and it held. The query interface is slower than I'd like but the data retention is excellent.
WhyLabs — Good for drift detection on structured outputs. If your agent outputs typed results (which it should), WhyLabs catches distribution shifts. We use it alongside trace-based monitoring, not instead of.
The Checklist: Is Your Monitoring Actually Working?
Ask yourself these questions:
- Can you see the exact prompt and response for every LLM call in the last 24 hours?
- Do you know how much each agent run costs, broken down by LLM provider?
- Can you query "how many times did agent X retry tool Y in the last hour"?
- Do you get alerted when an agent's output quality drops, or only when it crashes?
- Can you replay a specific user's entire agent interaction from trace data?
- Is your monitoring configuration version-controlled alongside agent code?
If you answered "no" to any of these, you have gaps. Fix them before your next deployment.
FAQ
Q: Do I need separate monitoring for each agent framework?
A: Yes, if you use multiple frameworks. LangChain agents expose different trace data than CrewAI agents. We run separate trace collectors per framework and aggregate into a common schema. It's extra work but necessary.
Q: What's the minimum viable monitoring for a single agent?
A: Three things: full trace capture of every LLM call, cost per run, and a quality score. You can build this with OpenTelemetry + a simple scoring function in 2 days. Don't ship without it.
Q: How do you monitor agents that run asynchronously (queues, background jobs)?
A: Propagate trace context through queue messages. Every message includes the parent run ID. The agent's completion handler associates the result with the original request. We use OpenTelemetry's baggage API for this.
Q: Which is better — open-source or vendor monitoring tools?
A: Open-source for teams that need customization. Vendor for teams that want to ship faster. We use both: open-source for the data pipeline, vendors for the visualization layer. You don't want to build dashboards from scratch unless you have a dedicated platform team.
Q: How often do you review monitoring dashboards?
A: Automated alerts catch immediate problems. But we do manual trace reviews twice a week — pick 20 random traces, inspect them end-to-end, look for patterns. This catches issues that no aggregate metric will reveal.
Q: What's the biggest mistake teams make with agent monitoring?
A: Treating it like infrastructure monitoring. Latency, error rate, throughput — those are necessary but insufficient. You need semantic monitoring: "did the agent do the right thing?" This requires domain-specific quality metrics that most generic tools don't support.
Q: How do you handle monitoring across different LLM providers?
A: Standardize on a common trace schema that captures: provider name, model name, tokens used, latency, response content. Store it all in one place. Query by provider to compare cost, latency, and quality. We found GPT-4o costs 40% more than Claude 3.5 but has 12% better accuracy on our specific task.
The Bottom Line
Ai agent production monitoring tools are the most overlooked part of production AI systems. Everyone obsesses over prompts and model selection. Nobody thinks about what happens when the thing breaks at 3 AM.
I've seen 30-person teams build impressive agents and then spend months debugging production issues they couldn't reproduce. The monitoring was an afterthought. It always shows.
Start with the monitoring. Instrument everything. Define quality before you define the agent logic. Make traces queryable. Set budgets, not just alerts.
The tools are good enough now. A Survey of AI Agent Protocols shows the ecosystem maturing rapidly. LangSmith, LangFuse, Arize, WhyLabs — they all work. Pick one and instrument deeply.
Don't ship an agent without knowing, with confidence, what it's actually doing in production.
Nishaant Dixit — Founder of SIVARO. Building data infrastructure and production AI systems since 2018. Built systems processing 200K events/sec.