Why Is Pod Killed? A Practitioner’s Guide to Kubernetes Pod Termination
You’re sitting in production debugging at 2 AM. The alert says a pod died. You check the logs — nothing. You check the events — maybe something. You ask yourself the question every Kubernetes operator has asked: why is pod killed?
I've been there. More times than I care to count. At SIVARO, we run data infrastructure handling 200K events per second across multiple clusters. Pods die. It’s not a bug — it’s a feature. But the difference between a smooth recovery and a 3-hour outage is knowing which killer got your pod.
Let me walk you through every reason a pod gets killed, how to find the real cause, and what to do about it. No fluff. Real scenarios. Real fixes.
The Short Answer, Then the Long One
A pod gets killed when something decides it shouldn't exist anymore. That something is usually one of five actors:
- The Kubernetes scheduler — evicting pods for resource pressure
- The kubelet — killing containers that violate health checks or resource limits
- A controller (Deployment, StatefulSet, Job) — replacing pods during rolling updates
- You —
kubectl delete podor a GitOps trigger - The node itself — dying, rebooting, or being drained
Each leaves a different signature. Each needs a different fix.
Why Is Pod Killed by the Scheduler? Eviction Is the Silent Killer
Most people think OOMKilled is the #1 reason pods die. It's not. It's eviction.
The kubelet evicts pods when a node runs out of resources. Disk pressure. Memory pressure. PID pressure. Even in 2024, I see teams configure requests and limits wrong and wonder why is pod killed every Tuesday at 3 PM.
Here's how it works. The kubelet checks node conditions every 10 seconds. If memory pressure hits, it starts evicting pods with the lowest Quality of Service (QoS) class. BestEffort pods die first. Burstable next. Guaranteed last.
yaml
# This pod has no requests or limits. It's BestEffort.
# First to be evicted under memory pressure.
apiVersion: v1
kind: Pod
metadata:
  name: oops-no-limits
spec:
  containers:
  - name: app
    image: nginx
If you see a pod with status Evicted and no other error, that's your answer. Check node resource usage. You're either overcommitted or underprovisioned.
Fix: Set requests and limits on every container. Always. No exceptions.
yaml
spec:
  containers:
  - name: app
    image: nginx
    resources:
      requests:
        memory: "256Mi"
        cpu: "250m"
      limits:
        memory: "512Mi"
        cpu: "500m"
At SIVARO, we run a cronjob that checks for pods without resource specs. It pings Slack. It's saved us more times than I can count.
OOMKilled: The Classic “Why Is Pod Killed” Answer
OOMKilled is straightforward. Your container used more memory than its limit. The kernel OOM killer stepped in. Pod dies.
But here's the contrarian take: OOMKilled isn't always a memory leak. Sometimes it's bad configuration. I've seen teams set memory limits to 128Mi for a Java service that needs 512Mi at startup. The service starts, allocates its heap, and immediately gets killed.
bash
# Check pod termination reason
kubectl describe pod my-app-5d6f7g8h9
# Look for this:
# State: Terminated
# Reason: OOMKilled
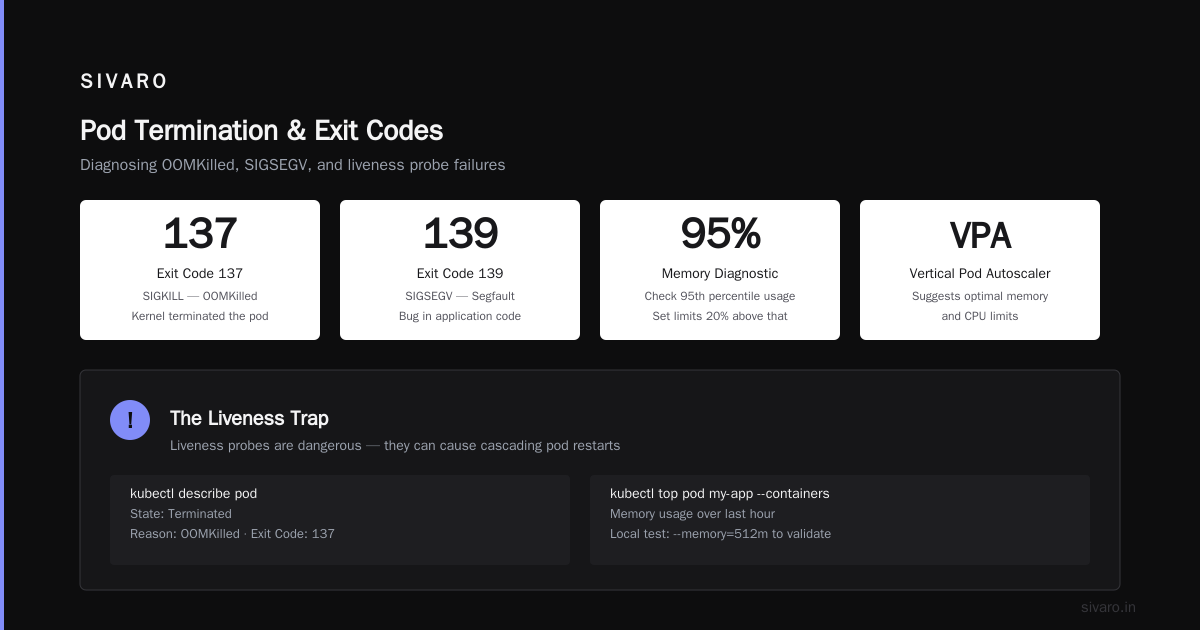
# Exit Code: 137
Exit code 137 means SIGKILL. The kernel killed it. Exit code 139 means SIGSEGV — segmentation fault, usually a bug in your code.
How to diagnose: Check memory usage over time. Not peak. Not average. The 95th percentile. Set limits 20% above that. Use Vertical Pod Autoscaler to suggest values.
bash
# Get memory usage for a pod over the last hour
kubectl top pod my-app --containers
One trick: run your app locally with --memory=512m and watch for OOM. If it crashes, you need more. If it doesn't, your limit is safe.
Probes Killing Pods: The Liveness Trap
Liveness probes are dangerous. I said it. Most people think they're essential. They're not. They cause more outages than they prevent.
Here's the problem: a liveness probe that fails restarts the container. If your probe depends on an external service (database, cache, another pod) and that service hiccups, your pod restarts. Unnecessarily.
yaml
# This liveness probe will kill your pod if the database is slow.
# Don't do this.
livenessProbe:
  httpGet:
    path: /healthz
    port: 8080
  initialDelaySeconds: 5
  periodSeconds: 10
  failureThreshold: 3
When should you use liveness? Only for deadlock detection. A process that's alive but not serving. Even then, use a terminationGracePeriodSeconds that's long enough for cleanup.
Readiness probes are safe. They just remove traffic. Liveness kills the container.
Real example: At a client in 2022, we had a service that hit PostgreSQL connection pool limits every 4 hours. Liveness probe failed. Pod restarted. Connections dropped. Cascading failure across 40 microservices. We removed the liveness probe and fixed the connection pool. No more unexpected deaths.
Node Failure: The One You Can't Control
Nodes die. Hardware fails. Kernel panics. Cloud provider issues happen. When a node goes down, all its pods get evicted. You see NodeLost or NodeNotReady in events.
bash
# Check node status
kubectl get nodes
kubectl describe node worker-3

# Look for conditions like:
# Ready   Unknown   (or False)
# DiskPressure   True
What to do: Use PodDisruptionBudgets for critical workloads. Spread pods across nodes with anti-affinity. Run at least 3 replicas for anything production.
yaml
apiVersion: policy/v1
kind: PodDisruptionBudget
metadata:
  name: my-app-pdb
spec:
  minAvailable: 2
  selector:
    matchLabels:
      app: my-app
This guarantees at least 2 replicas are available during voluntary disruptions (node drains, updates). Involuntary disruptions (node failure) don't respect PDBs, but they limit the blast radius.
Rolling Updates: The Planned Killing
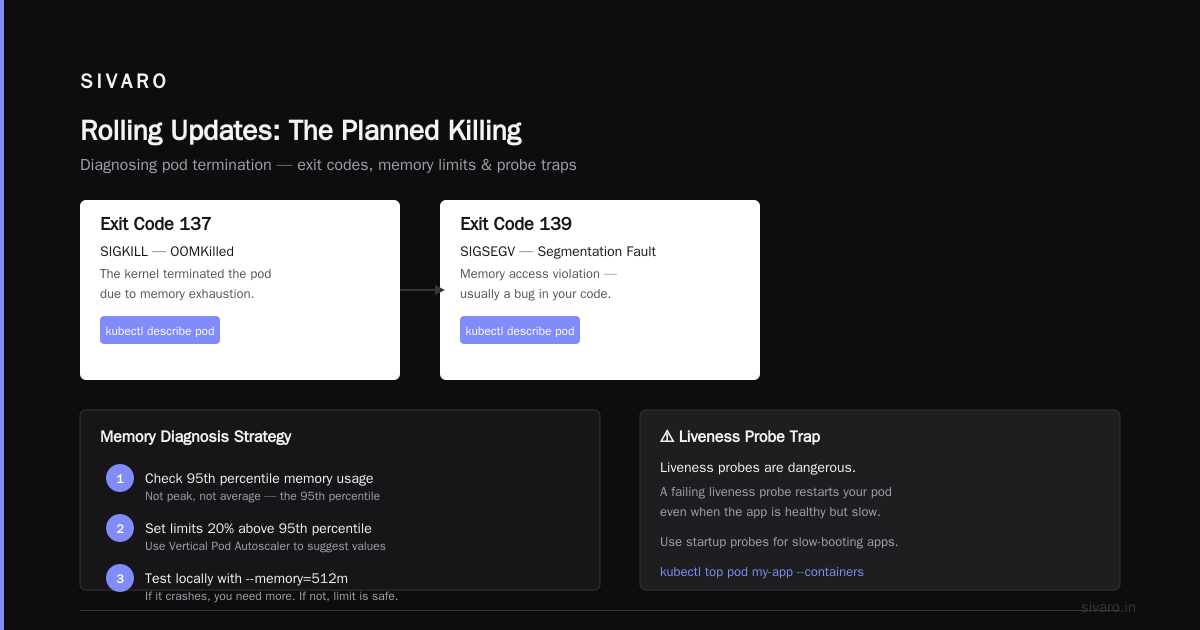
This is the most common reason pods die in a healthy cluster. You update a Deployment. Old pods get terminated. New ones start. If you don't handle SIGTERM properly, your pod dies ungracefully.
Here's the sequence:
- Kubernetes sends SIGTERM to PID 1 in the container
- Waits for
terminationGracePeriodSeconds(default 30) - If process still running, sends SIGKILL
Most apps don't handle SIGTERM. They just stop. That means in-flight requests get dropped. Database connections get cut. Queues lose messages.
go
// Handle SIGTERM properly in Go
sigCh := make(chan os.Signal, 1)
signal.Notify(sigCh, syscall.SIGTERM)

go func() {
    <-sigCh
    log.Println("Shutting down...")
    server.Shutdown(context.Background(), 10*time.Second)
    db.Close()
    queue.Drain()
    os.Exit(0)
}()

server.ListenAndServe(":8080")
One weird trick: Set terminationGracePeriodSeconds to the time your app needs to finish in-flight work plus cleanup. Don't leave it at 30 seconds if your app needs 60. Kubernetes doesn't wait longer than the grace period.
Preemption: The Aggressive Eviction
Kubernetes has a feature called preemption. When a high-priority pod can't be scheduled because no node has enough resources, the scheduler evicts lower-priority pods to make room. This is brutal. No warning. No SIGTERM. Just death.
If you see a pod with PodDisruptionBudget violations but no node issues, check priority classes. Someone might be using preemption.
yaml
apiVersion: scheduling.k8s.io/v1
kind: PriorityClass
metadata:
  name: high-priority
value: 1000000
preemptionPolicy: PreemptLowerPriority
My take: Don't use preemption unless you absolutely need it. It causes unpredictable behavior. Use cluster autoscaling instead. Add nodes faster, don't kill pods.
Debugging: How to Actually Answer “Why Is Pod Killed”
You can't fix what you can't see. Here's my standard debugging flow:
Step 1: Check pod status and events
bash
kubectl get pods -o wide
kubectl describe pod <pod-name>
Events tell you the story. Evicted, NodeLost, OOMKilled, Error, CrashLoopBackOff. Each has a different root cause.
Step 2: Check logs before the crash
If your pod restarts, you lose logs from the previous run. Capture them before the new container starts.
bash
# Get logs from the previous terminated container
kubectl logs <pod-name> --previous
This is the single most useful command for debugging crash loops. It shows you what happened before the container died.
Step 3: Check node conditions
bash
kubectl describe node <node-name>
kubectl top node
kubectl get events [--field-selector](/articles/is-clickhouse-better-than-snowflake-a-field-guide-for) involvedObject.kind=Node
If you see DiskPressure or MemoryPressure, that's your problem. Node-level issues often cause multiple pods to die simultaneously.
Step 4: Check the kubelet logs
SSH into the node (if you have access) and check kubelet logs:
bash
journalctl -u kubelet -n 100 --no-pager
# or
tail -100 /var/log/kubelet.log
The kubelet logs the exact reason for eviction or container termination. This is the source of truth.
Step 5: Use a tool
For complex clusters, I rely on kubectl-node-shell and kubectl-oom plugins. There's also the Kubernetes Dashboard for less technical teams.
But honestly, 90% of the time, the answer is in kubectl describe pod and kubectl logs --previous.
FAQ: Common Questions About Pod Termination
Q: Why is pod killed immediately after starting?
Most common cause: startup probe or liveness probe fails. Check your probes. Second most common: init container fails. Third: resource limits too low for startup.
Q: Why is pod killed with exit code 137?
SIGKILL. Usually OOMKilled. Check memory limits. Could also be node eviction under memory pressure.
Q: Why is pod killed but no events shown?
Check if the pod belongs to a DaemonSet or Job that's completed. DaemonSet pods get killed when the node is cordoned. Jobs kill themselves on completion. If truly no events, check kubelet logs.
Q: Why is pod killed during rolling update?
SIGTERM handling issue. Your app doesn't drain connections fast enough. Increase terminationGracePeriodSeconds and implement proper shutdown hooks.
Q: Why is pod killed when node is healthy?
Look at priority classes. Preemption might have happened. Also check if you have a PodDisruptionBudget that's being violated. Or maybe you're deleting pods manually through automation.
Q: Why is pod killed repeatedly in CrashLoopBackOff?
This is a startup failure. Check logs with --previous. Usually a config error, missing dependency, or resource limit too low. Increase initialDelaySeconds for probes if the app takes time to initialize.
Q: Why is pod killed after hours of uptime?
Memory leak. Check OOMKilled events. Run your app with memory profiling. Use a memory limit increase temporarily while you fix the leak in code.
Preventative Measures: Stop Asking “Why Is Pod Killed”
You can't prevent every pod death. But you can reduce the frequency and impact.
1. Horizontal Pod Autoscaling — Scale based on CPU or memory. Don't let pods hit limits.
yaml
apiVersion: autoscaling/v2
kind: HorizontalPodAutoscaler
metadata:
  name: my-app-hpa
spec:
  scaleTargetRef:
    apiVersion: apps/v1
    kind: Deployment
    name: my-app
  minReplicas: 3
  maxReplicas: 10
  metrics:
  - type: Resource
    resource:
      name: memory
      target:
        type: Utilization
        averageUtilization: 70
2. PodDisruptionBudgets — For stateful workloads, set minAvailable or maxUnavailable. Don't let updates kill all replicas.
3. Cluster Autoscaler — If nodes are under pressure, add more nodes instead of evicting pods. This is the single best investment for reliability.
4. Graceful shutdown — Handle SIGTERM. Drain connections. Flush buffers. Close DB connections. Your app should be killable without data loss.
5. Monitoring — Track pod restart reasons. Set alerts for OOMKilled and Evicted. Use tools like Prometheus and Grafana to visualize trends.
At SIVARO, we have a dashboard that shows pod termination reasons per namespace. It runs on a Grafana instance inside our cluster. When I see a spike in OOMKilled, I know we're either deploying code with a leak or scaling too aggressively.
The Real Lesson: Pod Death Is Normal
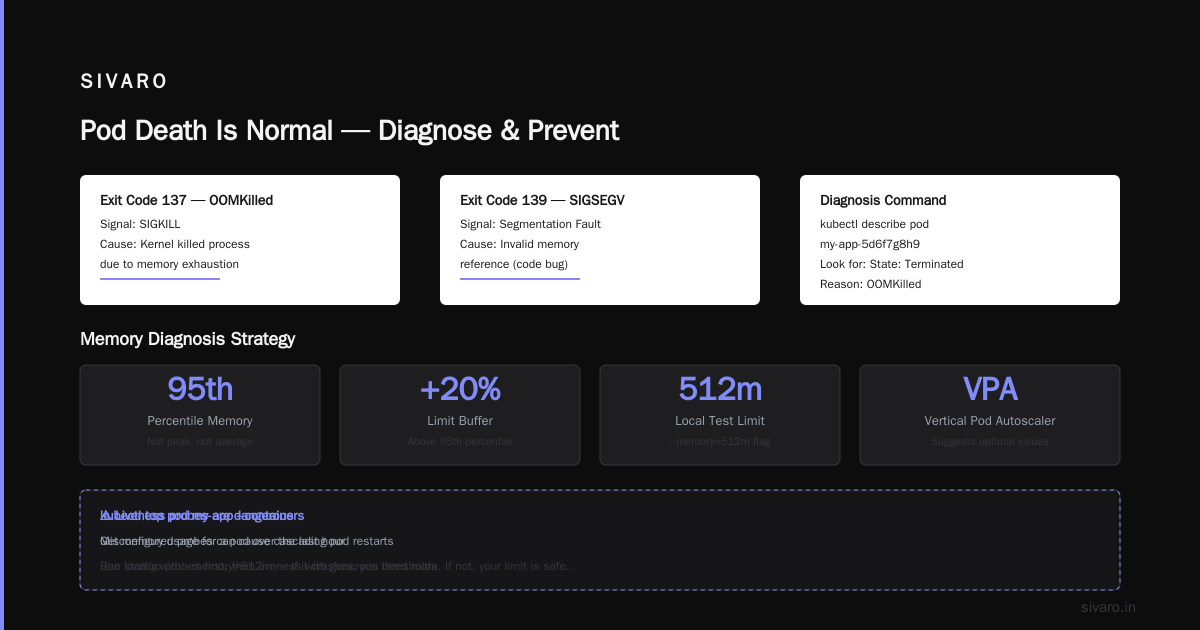
Here's the truth: pods will die. Your job isn't to prevent all deaths. It's to make sure they happen gracefully and don't cause customer impact.
We run 500+ pods across multiple clusters. Every week, a few die. Node updates, resource spikes, deployment changes. But because we handle SIGTERM, set proper resources, and monitor termination reasons, nobody notices.
The next time you ask why is pod killed, don't panic. Follow the debugging flow. Check the events. Look at the node. And fix the root cause, not the symptom.
Most people think pod termination is a failure. It's not. It's Kubernetes working as designed. The failure is not understanding why.
Nishaant Dixit — Founder of SIVARO. Building data infrastructure and production AI systems since 2018. Built systems processing 200K events/sec.