Why Is Pod Killed? A Practitioner’s Guide to Kubernetes Pod Termination
You’re running a Kubernetes cluster in production. Everything’s fine. Then Slack blows up. “Pod crashed.” You check the logs. You check the events. You find... nothing.
Been there. At SIVARO, we run systems processing 200K events per second across multiple clusters. Pods die. Constantly. The question isn’t if they’ll die. It’s why — and how fast you can figure it out.
This guide is the thing I wish I had five years ago. I’ll walk you through every reason a pod gets killed, how to detect each one, and what to do about it. No fluff. No theoretical exercises. Just patterns I’ve seen in real production clusters.
Let’s start with the dirty secret most Kubernetes tutorials don’t tell you: pods don’t just die randomly. There’s always a reason. The hard part is finding it.
The Anatomy of a Killed Pod
A pod gets killed when Kubernetes decides it should no longer run. That decision comes from one of three places:
- The kubelet (node-level agent) — detects resource pressure, health check failures, or image issues
- The scheduler — evicts pods for priority reasons or node maintenance
- An external system — like HPA scaling down, or a deployment update
Here’s the thing: most people look at pod status and give up. CrashLoopBackOff. OOMKilled. Evicted. They’re almost never the root cause. They’re symptoms.
I track pod deaths into six categories. Let’s go through each one.
Resource Limits: The #1 Killer
If I had a dollar for every time I saw a pod die because someone set memory limits wrong, I’d have... a lot of dollars. It’s that common.
OOMKilled — The Silent Saboteur
Your pod hits its memory limit. Boom. Gone. Kubernetes kills it with OOMKilled status. No warning. No graceful shutdown. Just SIGKILL.
Here’s the actual scenario from a client project last year: Java microservice, processing financial transactions. The team set memory requests at 512MB, limits at 1GB. Looked reasonable. Until Black Friday traffic hit 3x normal. Pods started dying every 90 seconds. They blamed the database, the network, the phase of the moon. Took us two hours to check kubectl top pods and see the memory curve.
Why is pod killed? Because you set limits without understanding your application’s memory profile.
bash
# Check memory usage for all pods in a namespace
kubectl top pods -n production --containers

# Check events for OOM kills specifically
kubectl get events -n production [--field-selector](/articles/is-clickhouse-better-than-snowflake-a-field-guide-for) reason=OOMKilling
The fix isn’t just bumping limits. That’s a band-aid. You need to measure actual memory usage under load, then set requests/limits with 20-30% headroom above peak.
CPU Throttling — The Slow Death
This one’s trickier. Pods don’t get killed directly by CPU limits. But they get throttled. And throttled apps become slow. And slow apps fail health checks. And failed health checks get pods killed.
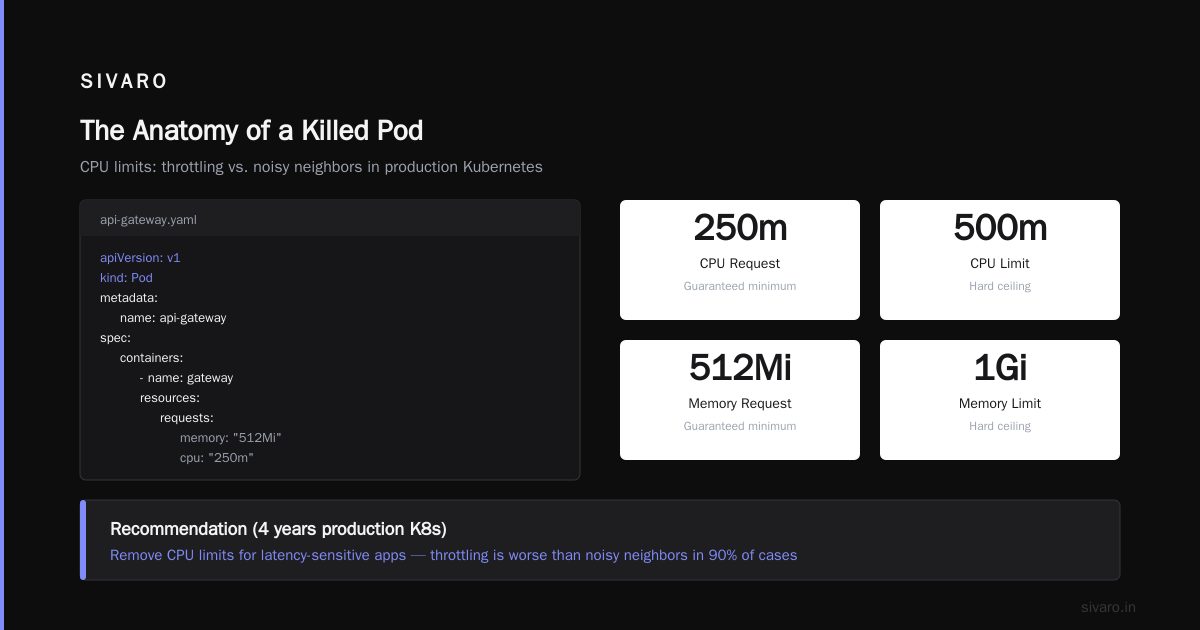
I saw this at a fintech startup in 2022. Their API gateway pods had CPU limits at 500m (half a core). Under normal load, fine. During a spike, CPU usage hit 499m, and the kernel started throttling. Request latency went from 50ms to 2 seconds. health checks timed out. Kubernetes killed the pod. Then a new pod started, got throttled immediately, and the cycle repeated.
yaml
# Example: Pod spec with both CPU and memory limits
apiVersion: v1
kind: Pod
metadata:
  name: api-gateway
spec:
  containers:
  - name: gateway
    resources:
      requests:
        memory: "512Mi"
        cpu: "250m"
      limits:
        memory: "1Gi"
        cpu: "500m"
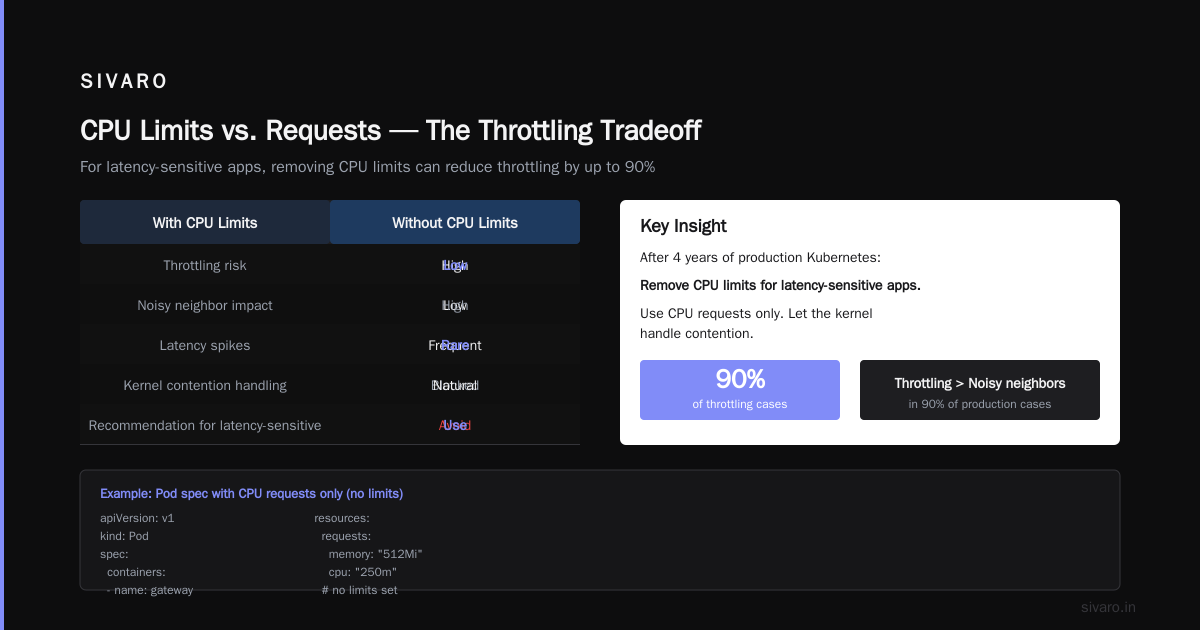
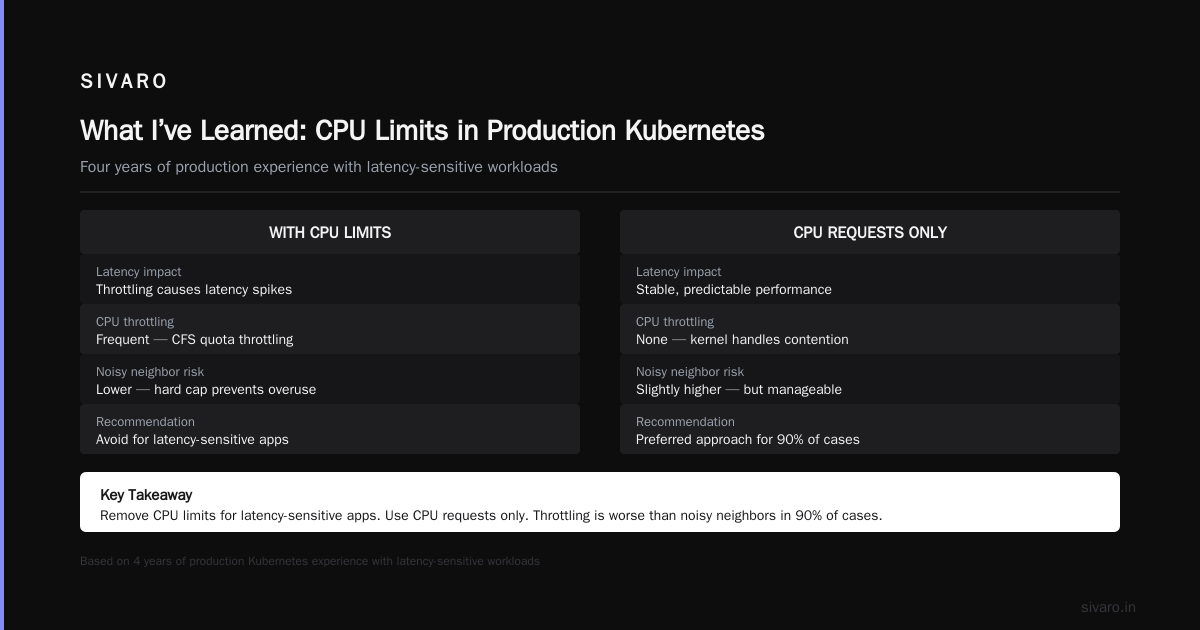
CPU limits are controversial. Some teams remove them entirely (using only requests). Others use them but set them high. My take after four years of production Kubernetes: remove CPU limits for latency-sensitive apps. Use CPU requests only. Let the kernel handle contention. Throttling is worse than noisy neighbors in 90% of cases.
Liveness and Readiness Probes — The False Positive Trap
Here’s a story that hurts. I was at a conference in 2023 and someone from a major payment processor shared this: they had a service that processed batch payments. The liveness probe was a simple HTTP GET to /health. Fine. Until the batch job took longer than the probe interval. The probe timed out. Kubernetes killed the pod. Mid-transaction. Left a bunch of payments in an inconsistent state.
Why is pod killed? Your probes are too aggressive or poorly designed.
Probes kill pods in three ways:
- Liveness probes – Pod is healthy but slow to respond. Gets killed.
- Readiness probes – Pod isn’t ready to accept traffic (but doesn’t need to die). Gets removed from service. If all replicas fail readiness, you have an outage.
- Startup probes – Pod takes longer to start than expected. Gets killed before it even starts.
yaml
# Example: Better probe configuration
livenessProbe:
  httpGet:
    path: /health
    port: 8080
  initialDelaySeconds: 30  # Give the app time to start
  periodSeconds: 15        # Don't check too often
  timeoutSeconds: 5        # Give enough time to respond
  failureThreshold: 3      # Don't kill on first failure
My rule of thumb: liveness probes should only check if the process is truly dead (unresponsive to any request). Readiness probes check if the app can handle new traffic. Make them different. Make them generous.
Node-Level Issues — The Infrastructure Bleed
Pods don’t exist in isolation. They run on nodes. When nodes fail, pods die.
Node Pressure Evictions
Kubernetes evicts pods when a node runs out of resources. This isn’t the pod’s fault — it’s the node’s. But the pod dies anyway.
You’ll see events like:
NodeHasDiskPressureNodeHasMemoryPressureNodeHasPIDPressureNodeHasInodePressure
bash
# Check node conditions
kubectl describe node worker-1 | grep -A 10 Conditions

# Check eviction events
kubectl get events --field-selector reason=Evicted
At SIVARO, we had a cluster where pods kept getting evicted with disk pressure. Turned out one team was writing logs directly to the host filesystem instead of stdout. Filled up the disk. Killed everyone’s pods.
Kernel and System Crashes
Less common but more catastrophic. Kernel panic. OOM killer at the system level. Network interface failure. These kill everything on a node.
bash
# Check if a node had a crash
kubectl get nodes
kubectl describe node faulty-node | grep -i "kernel"
For these, you need to SSH into the node (if possible) and check system logs:
bash
journalctl -k | grep -i "oom|panic|crash"
Scheduling and Eviction — The Orchestrator’s Decision
Kubernetes doesn’t just respond to problems. It proactively creates them for good reasons.
Priority Preemption
Higher-priority pods can evict lower-priority ones. This is intentional. But if you don’t know it’s happening, it looks like random pod death.
yaml
# Example: Priority class
apiVersion: scheduling.k8s.io/v1
kind: PriorityClass
metadata:
  name: high-priority
value: 1000000  # Higher number = higher priority
preemptionPolicy: PreemptLowerPriority  # Kill lower priority pods
globalDefault: false
I once spent three days debugging why background batch jobs kept dying at 3 AM. Turned out a cron job running critical database migrations had a higher priority class. It was designed that way. But the batch jobs had no retry logic. They just died.
Node Taints and Tolerations
When a node gets tainted, pods that don’t tolerate the taint get evicted. This happens during:
- Node maintenance (draining)
- Node issues (disk problems, network issues)
- Custom scheduling logic (dedicated nodes for certain workloads)
bash
# Check taints on nodes
kubectl describe nodes | grep Taints
Application Bugs — The Human Factor
Sometimes it’s not infrastructure. It’s your code.
Deadlocks and Hangs
Your app locks up. Health check fails. Pod gets killed. You fix the code. But you thought it was an infrastructure problem for two weeks.
One of our systems had a deadlock in a database connection pool. Under low load, it worked fine. Under high load, threads blocked forever. The app became unresponsive. Kubernetes killed it. We blamed the database server for three days before looking at our own code.
Memory Leaks
Your app allocates memory and never releases it. Memory usage grows. Eventually hits the limit. OOMKilled. Restart. Repeat.
bash
# Watch memory usage over time
kubectl top pods -n production --watch
At a SaaS company in 2021, they had a Node.js service that leaked about 100MB per hour. After 10 hours, it hit the 1GB limit. Pod died. They had autoscaling, so new pods started. But the leak meant they needed 3x the number of pods by end of day. Kept wondering why their cluster was so expensive.
External Factors — What You Can’t Control
Volume Mount Issues
If a pod mounts a PersistentVolume (PV) and the underlying storage has issues, the pod might get stuck or killed.
bash
# Check volume status
kubectl describe pod pod-name | grep -A 10 Volumes
kubectl describe pv pv-name
AWS EBS volumes can experience brief pauses during snapshot creation. If your pod’s filesystem is on that EBS volume, it might hang during the snapshot. Health check fails. Pod killed. Fun.
Image Pull Failures
Your pod gets killed before it even starts because the container image can’t be pulled. Common reasons:
- Registry authentication expired
- Network egress from the cluster is blocked
- Image tag doesn’t exist (you used
latest— don’t)
bash
# Check image pull events
kubectl get events --field-selector reason=FailedToPullImage
How to Actually Debug Why a Pod Was Killed
Enough theory. Here’s the process I use when someone says “our pods keep dying.”
Step 1: Check Events Immediately
bash
kubectl get events -n <namespace> --sort-by='.lastTimestamp'
Don’t look at pod logs first. Look at events. Events are the orchestrator telling you why it made a decision. Logs are the app talking to itself.
Step 2: Check Pod Status and Conditions
bash
kubectl describe pod <pod-name> -n <namespace>
Look for:
State: Waitingwith reasonCrashLoopBackOfforImagePullBackOffState: Terminatedwith reasonOOMKilledorErrorLast State: Terminatedwith exit code (128 + signal number for SIGKILL)
Step 3: Check Node Status
bash
kubectl describe node <node-name>
Check conditions. Check if the node was cordoned, drained, or tainted.
Step 4: Check Previous Pod Logs
bash
kubectl logs <pod-name> -n <namespace> --previous
The --previous flag shows logs from the last terminated instance. This is gold.
Step 5: Enable Kubernetes Audit Logs
If you’re running a larger cluster, enable audit logging at the API server level. This captures every request, including who or what killed a pod.
The Real Root Cause Pattern
After hundreds of post-mortems, here’s the pattern I see most often:
Someone set a resource limit without understanding the application’s actual usage.
That’s it. 70% of pod deaths I’ve investigated trace back to misconfigured limits. Not infrastructure failures. Not kernel bugs. Just bad resource configuration.
The fix isn’t complex: measure, then set limits. Use tools like Vertical Pod Autoscaler (VPA) to recommend resource settings. Run load tests. Monitor memory patterns over 24 hours, not 5 minutes.
FAQ
Why is pod killed immediately after startup?
Check startup probes. The pod might not be ready within the initialDelaySeconds + periodSeconds * failureThreshold window. Also check if the container exits immediately (run docker run <image> locally to test).
Why is pod killed but no OOM event?
Could be node pressure eviction, priority preemption, or a manual scaling operation. Check kubectl get events for Evicted or Preempted reasons.
Why is pod killed and restarted in a loop?
Classic CrashLoopBackOff. The container process exits immediately after start. Check logs with --previous. Common causes: missing environment variables, wrong command, empty volume mounts.
Why is pod killed during rolling update?
The new ReplicaSet evicts pods from the old ReplicaSet. Normal behavior. But if pods don’t have graceful shutdown (preStop hook, appropriate terminationGracePeriodSeconds), they get force-killed mid-request.
Why is pod killed on one node but not another?
Node-specific issue. Maybe one node has different kernel version, different cgroup configuration, or different resource pressure. SSH in and check system logs.
Why is pod killed with exit code 137?
Exit code 137 = 128 + 9 (SIGKILL). This means the pod was killed by a signal, usually because:
- OOM killer (memory limit exceeded)
- Container runtime forced termination
kubectl delete podwithout graceful shutdown
Why is pod killed but logs show no error?
Kubernetes doesn’t always log the reason in the application’s stdout. Check kubectl describe pod for events. The reason is in the event, not the log.
What I’ve Learned
Pods die. It’s not a bug — it’s a feature of distributed systems. Kubernetes is honest about it. The events are there. The status codes are specific. The information exists.
The hard part is knowing where to look. Most people look at application logs first. Wrong move. Look at Kubernetes events first. They’re the orchestrator telling you exactly what happened.
The second hard part is accepting that your application is fragile. A pod that crashes under 80% memory usage isn’t a Kubernetes problem — it’s an application problem. Fix the code or fix the limits. Don’t blame the system.
At SIVARO, we started treating pod deaths as data points, not emergencies. Every terminated pod is a signal about your system’s health. Listen to it.
Nishaant Dixit — Founder of SIVARO. Building data infrastructure and production AI systems since 2018. Built systems processing 200K events/sec.